Best Selling Products

Adobe Premiere Pro Account
99 USD
Plugin Retouch4me
69 USD

MidJourney Account
29 USD
Genuine Adobe Illustrator account
99 USD
Windows 10 & 11 Pro Key
36 USD

Capcut Pro 1 Year
39 USD

Adobe Photoshop Copyright - Full App
120 USD

ChatGPT Plus Account (GPT-4)
16 USD
Upgrade Duolingo Super
29 USD
Upgrade genuine Capture One account
120 USD

Copyright Adobe Lightroom Account
59 USD

Genuine Cheap Canva Pro
39 USD
Upgrade Genuine Office 365
49 USD
Autodesk All App Account Copyright
120 USD

Freepik Premium Account
59 USD
Tips for designing beautiful infographics that attract viewers at first sight
Nội dung
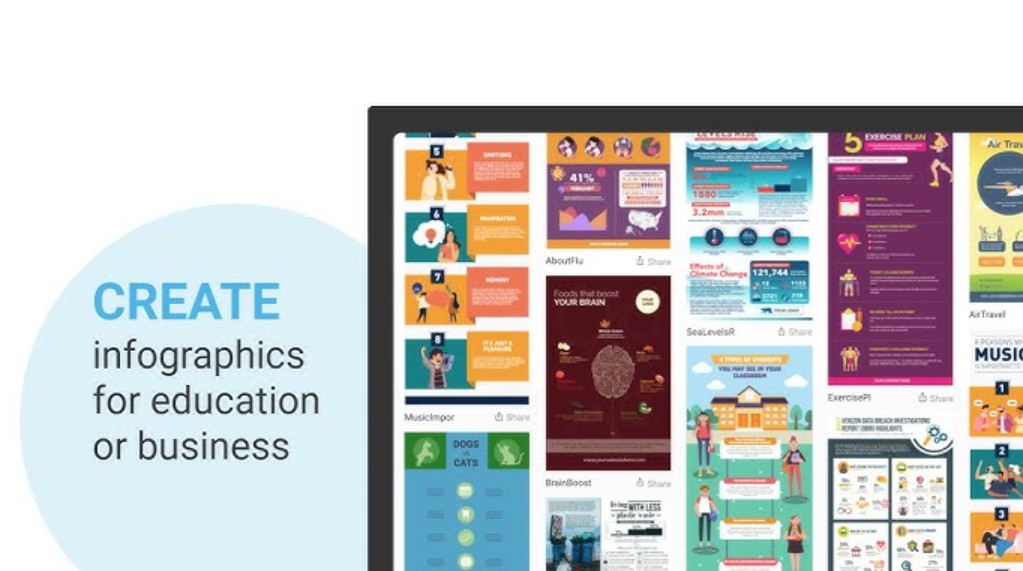
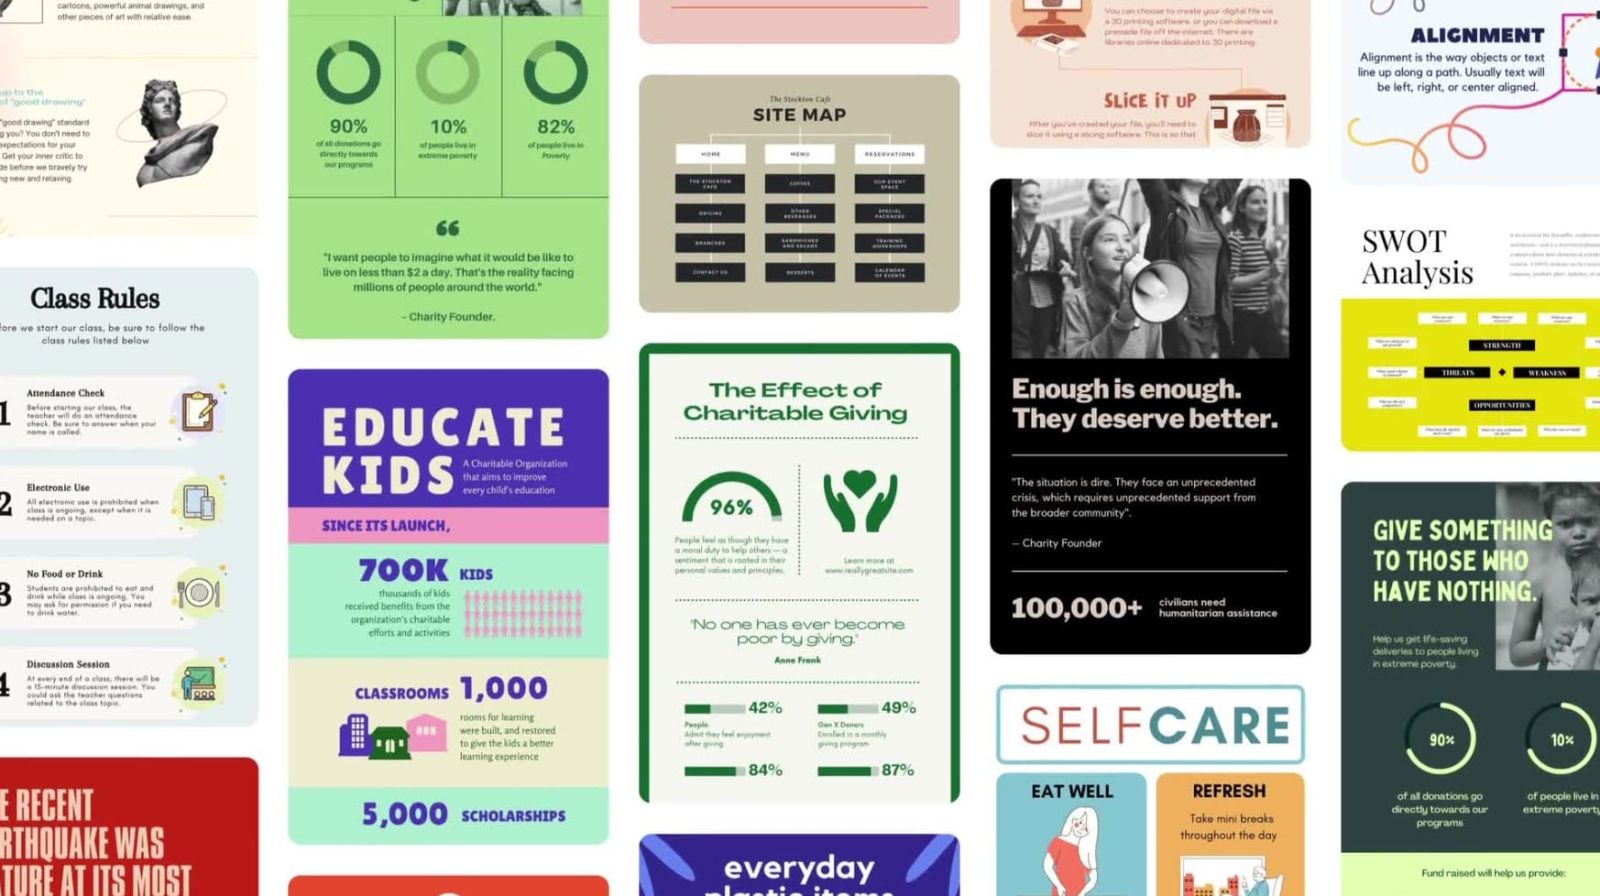
Infographic is a combination of “Information” and “Graphic”, simply understood as information graphics. This is a way to present data, knowledge or a story through illustrations, icons, colors, charts and writing. Instead of providing long paragraphs of text, Infographic helps to arrange and visualize information so that viewers can easily receive, analyze and remember.

Modern users no longer have much patience to read long paragraphs of text. Instead, they are often attracted to visual content that is easy to see, easy to understand and has the ability to convey messages quickly. This is the reason why Infographic was born and increasingly asserts its important position in graphic design as well as in communication and marketing activities.
Infographics are not just beautiful pictures, but also tools to condense and visualize data, helping readers receive information easily. With just a few seconds of looking at an Infographic, users can grasp the main idea that would otherwise take them minutes, even hours to read the whole text. Especially in the field of marketing, where customers' attention is extremely valuable, Infographics have proven their power in conveying short but impressive messages.
This article will give you a comprehensive view of Infographic, from the concept, role, reasons to use to important factors to note when designing. Besides, we will also explore tips to make your Infographic stand out, easy to remember and finally learn about beautiful, professional Infographic design software to help you start creating immediately.
1. What is an Infographic? What is Infographic Design?
Infographic is a combination of “Information” and “Graphic”, simply understood as information graphics. This is a way to present data, knowledge or a story through illustrations, icons, colors, charts and writing. Instead of providing long paragraphs of text, Infographic helps to arrange and visualize information so that viewers can easily receive, analyze and remember.
Infographic design is not just about decorating text into beautiful images. It is a creative process in which the designer must clearly understand the core message to be conveyed, choose the appropriate expression and arrange the layout logically. A successful infographic is a harmonious combination of aesthetics and information, both eye-catching and with clear value.

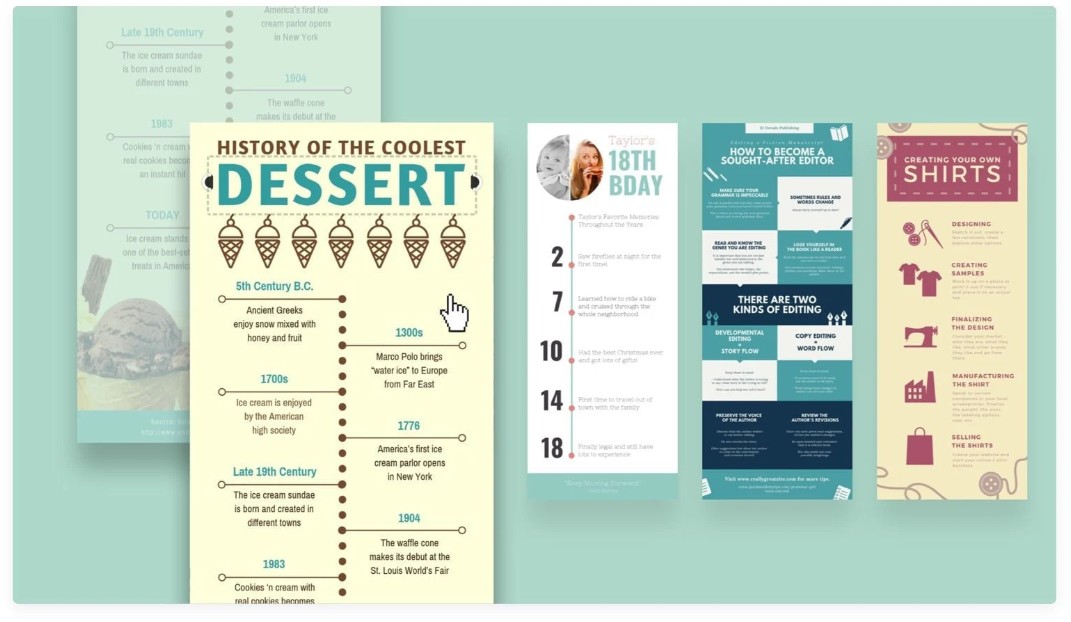
Nowadays, Infographics appear in many different forms. The most common type is static Infographics, usually in JPEG or PNG format, which are widely used in articles, research documents, reports or social networks. In addition, animated Infographics with gentle motion effects often appear in videos or presentation slides. More specifically, interactive Infographics allow users to click on each section to see details, often applied in online reports or data journalism. Each type of Infographic has its own advantages but all aim at the same goal: turning complex information into easy-to-understand and attractive images.
2. The Role of Infographics in Marketing
In Marketing, the most important thing is not only the content but also the way it is delivered. A campaign with a good message but a confusing presentation will have a hard time attracting customers. Infographics act as a bridge, turning complex messages into visual, accessible and shareable content.
Infographics help brands capture attention in just a few seconds. Amidst a barrage of social media posts, a colorful, well-organized infographic is sure to make users stop. This is a huge competitive advantage in an age where customer attention spans are getting shorter and shorter.
Infographics not only make a great first impression, but also help simplify complex content. Dry numbers and lengthy reports can become more digestible when transformed into charts, icons or illustrations. Instead of skimming through, viewers tend to stay longer to analyze and remember the information.
Another benefit of Infographics in Marketing is their ability to go viral. People love to share images that are beautiful, easy to understand and useful. Therefore, a well-designed Infographic can become an effective communication tool, spreading the brand message naturally without the need for large advertising costs.
3. Why use Infographics?
Using Infographic is not only a temporary trend but also an optimal solution in conveying information. The first reason is saving time. Instead of spending minutes reading a long article or report, viewers only need a few seconds to understand the main content through Infographic. In the context of speed being a decisive factor in communication, this brings a great advantage.
Second, Infographics are aesthetically pleasing. People are more attracted to images than text. When colors, fonts, and illustrations are combined harmoniously, Infographics are not only easy to look at but also inspire viewers to absorb information.
Third, infographics are multi-platform. A single design can be used in a blog post, posted on Facebook, shared on Instagram, embedded on a website, or even printed as a poster. This flexibility saves effort and increases communication effectiveness.
In addition, Infographics also strongly support SEO. High-quality Infographics are often cited and shared by many other websites, thereby bringing natural backlinks and increasing traffic. This contributes to improving search engine rankings, helping businesses reach more potential customers.
All of the above reasons show that Infographic is not only a tool to beautify content but also a smart strategy to increase communication and marketing effectiveness.
4. Important elements that create an Infographic
For an Infographic to be truly successful, the designer cannot rely solely on aesthetic intuition. There are several important factors that need to be ensured.
First of all, the content must be short and concise. Infographics are not the place to present each argument in detail, but to summarize, select and condense the main ideas. Viewers should be able to understand the message after just a few seconds of observation.
Next is the logical layout. Information needs to be arranged in a logical order, leading the viewer from one idea to another naturally. A messy, disorganized infographic will make users skip it immediately.
Color is also an important factor. Color is not only decorative but also evokes emotions, creates emphasis and distinguishes content sections. Harmony in the color palette makes Infographics both beautiful and easy to read.
In addition, images and icons act as visual representations of information. They help viewers quickly understand the meaning without having to read each word carefully. Choosing the right icon also shows professionalism in design.
Finally, infographics need to be optimized for easy sharing. Reasonable size, light capacity and popular format help infographics spread quickly across many different platforms.
When all these elements are combined harmoniously, Infographic becomes a powerful tool, both attractive and effective in conveying information.
5. Tips to Make Your Infographic Stand Out
Not every infographic is going to be compelling. To stand out, you need a clever design strategy.
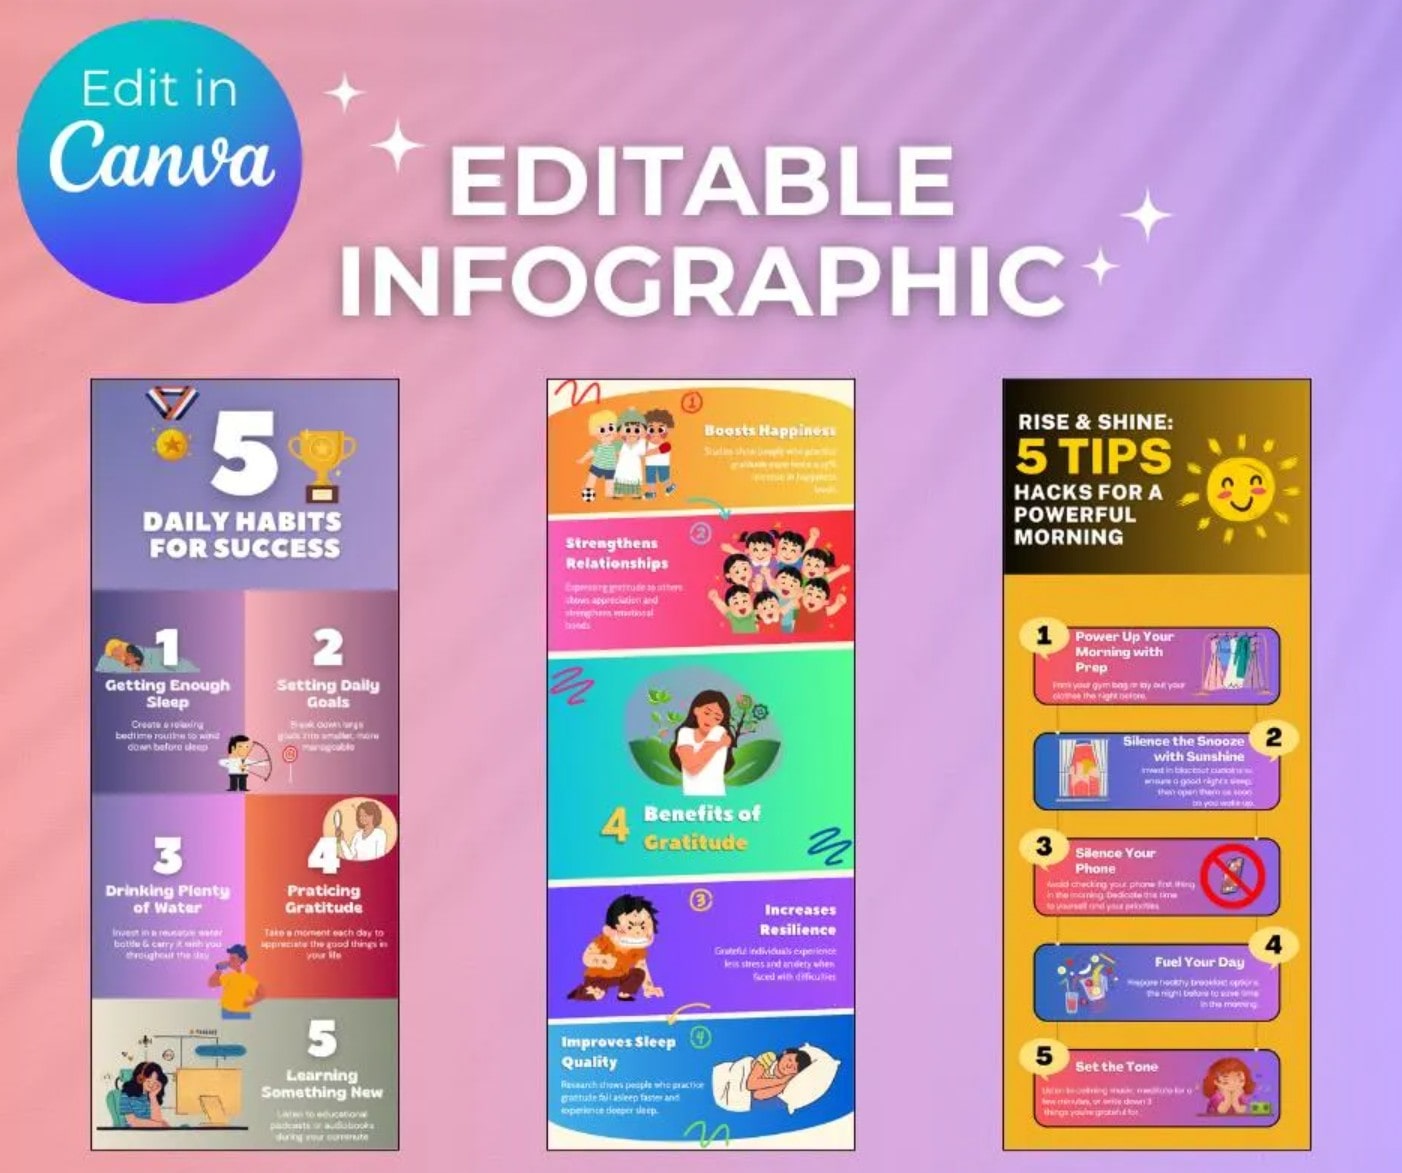
First, clearly define your target audience. An infographic for students will need vibrant colors and cute icons, while an infographic for investors needs to be minimalist, sophisticated, and emphasize data. Once you understand who your audience is, you will be able to choose the appropriate design style.
Another important tip is to use storytelling. Instead of just listing dry data, turn your infographic into a story with a beginning, a climax, and an end. Stories not only make information easier to digest, but also evoke emotions, helping viewers remember it longer.
In addition, it is necessary to focus on one main message. Infographics that contain too much information will confuse the viewer and make it difficult to grasp the main idea. A successful design is when the user can summarize the message in just one sentence after viewing it.
Simplifying charts and numbers is also important. A good infographic is not a place containing a series of complicated charts but a smart, easy-to-understand illustration. Instead of cumbersome tables, use shapes, icons and colors to clarify the data.
Finally, ensure consistency in your design. Fonts, colors, image sizes, and styles should all be consistent. This consistency makes your infographic look professional, easy to read, and builds trust with your audience.
6. Software for designing beautiful, professional infographics
Nowadays, designing Infographics is no longer too difficult thanks to the support of many software and online tools. Depending on your needs and skills, you can choose the appropriate tools.
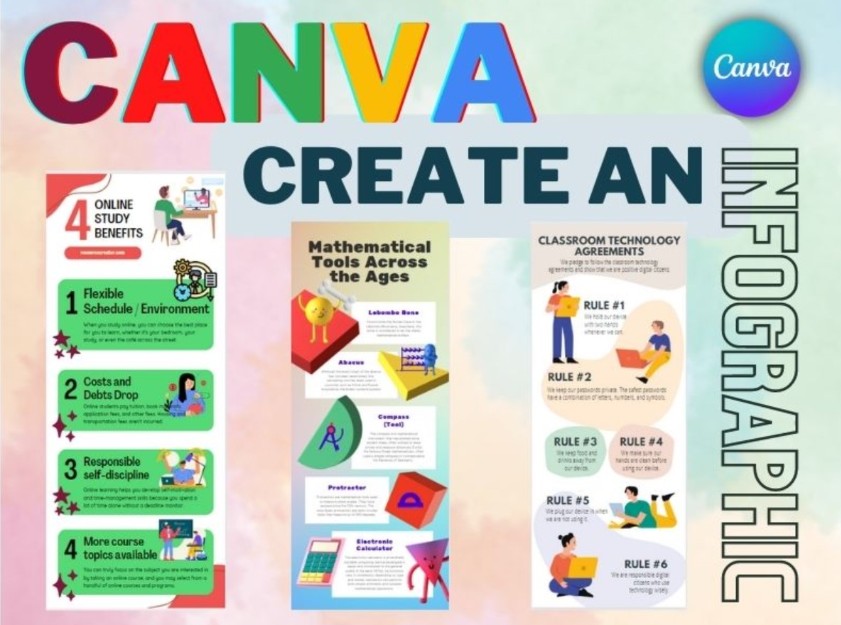
Canva is the most popular online software today. With a simple interface, a rich library of templates and flexible customization, Canva is suitable for both beginners and professional marketers.
Visme is a powerful tool for designing infographics, presentations, and reports. It offers advanced editing tools and a high-quality image library. With Visme, you can create designs that are both creative and professional.
Piktochart was built with a focus on Infographics. Piktochart's strength is its rich library of charts and icons, which help illustrate data in an intuitive and easy-to-understand way.
Venngage is chosen by many businesses thanks to its high customization capabilities and diverse design library. In addition to Infographics, Venngage also supports creating professional reports and documents, very suitable for the business environment.
For professional designers, Adobe Illustrator is still the number one tool. Not limited by available templates, Illustrator allows you to create exclusive Infographics from scratch, ensuring uniqueness and difference.
Finally, Infogram is a great choice for those who want to combine complex data with beautiful design. Infogram supports dynamic infographics and visual reports, helping to convey data vividly.
7. Conclusion
Infographics have proven their superior power in conveying information concisely, visually and attractively. From helping viewers save time, increasing their ability to remember, to creating a powerful viral effect, Infographics deserve to become an indispensable tool in Marketing, education and many other fields.
To design a successful Infographic, you need to pay attention to concise content, logical layout, harmonious colors and consistency. At the same time, choosing the right design software will also help you save time and improve product quality.
Whether you are a marketer, educator, journalist or anyone who wants to convey their message creatively, Infographic always provides the optimal solution. Start designing today with the support of professional software, you will realize the great power of images in conquering the hearts and memories of viewers.


VIP Products


Best Selling Products
Adobe Premiere Pro Account
99 USD
Plugin Retouch4me
69 USD
MidJourney Account
29 USD
Genuine Adobe Illustrator account
99 USD
Windows 10 & 11 Pro Key
36 USD
Capcut Pro 1 Year
39 USD
Adobe Photoshop Copyright - Full App
120 USD
ChatGPT Plus Account (GPT-4)
16 USD
Upgrade Duolingo Super
29 USD
Upgrade genuine Capture One account
120 USD
Copyright Adobe Lightroom Account
59 USD
Genuine Cheap Canva Pro
39 USD
Upgrade Genuine Office 365
49 USD
Autodesk All App Account Copyright
120 USD
Freepik Premium Account
59 USD