Best Selling Products
Freepik Premium Account
59 USD
Adobe Premiere Pro Account
99 USD
Genuine Cheap Canva Pro
39 USD
Capcut Pro 1 Year
39 USD

ChatGPT Plus Account (GPT-4)
16 USD
Adobe Photoshop Copyright - Full App
120 USD
Upgrade genuine Capture One account
120 USD
Copyright Adobe Lightroom Account
59 USD
Upgrade Genuine Office 365
49 USD

MidJourney Account
29 USD
Upgrade Duolingo Super
29 USD
Plugin Retouch4me
69 USD
Genuine Adobe Illustrator account
99 USD
Autodesk All App Account Copyright
120 USD
Windows 10 & 11 Pro Key
36 USD
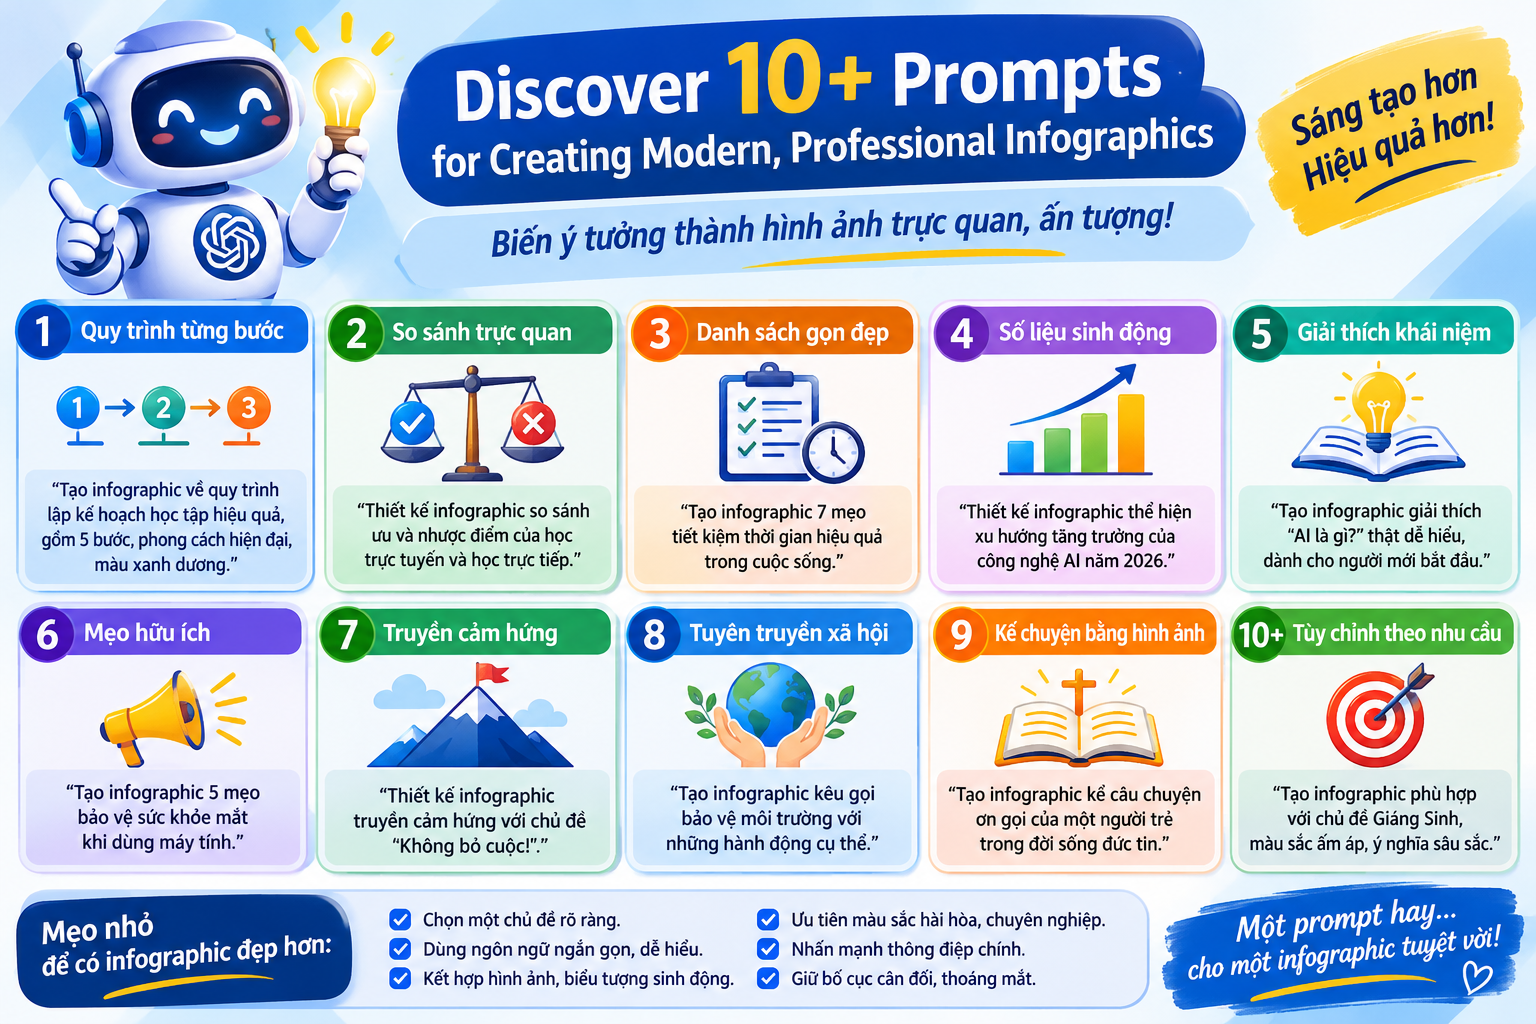
Discover 10+ prompts for creating modern, professional infographics.
Nội dung
- 1. Formula for writing a standard infographic prompt.
- 2. Templates for creating beautiful, professional infographics.
- 2.1. Process-based infographic prompt template
- 2.2. Infographic prompt template in comparison format
- 2.3. Infographic prompt template for summarizing knowledge.
- 3. How to use AI to create custom infographic prompts
- 4. Common mistakes when writing prompts for creating infographics
- 5. Conclusion
Using infographic creation prompts correctly helps you transform lengthy content into visually appealing, easy-to-understand, and engaging images. Simply describe the topic, layout, colors, and information you need to convey, and you can quickly brainstorm design ideas using tools like ChatGPT, Gemini, or Ideogram. Whether for academic purposes, work reports, or social media communication, the prompt templates below will save you time and help you create professional-looking infographics. Let''s explore them with Sadesign!
1. Formula for writing a standard infographic prompt.
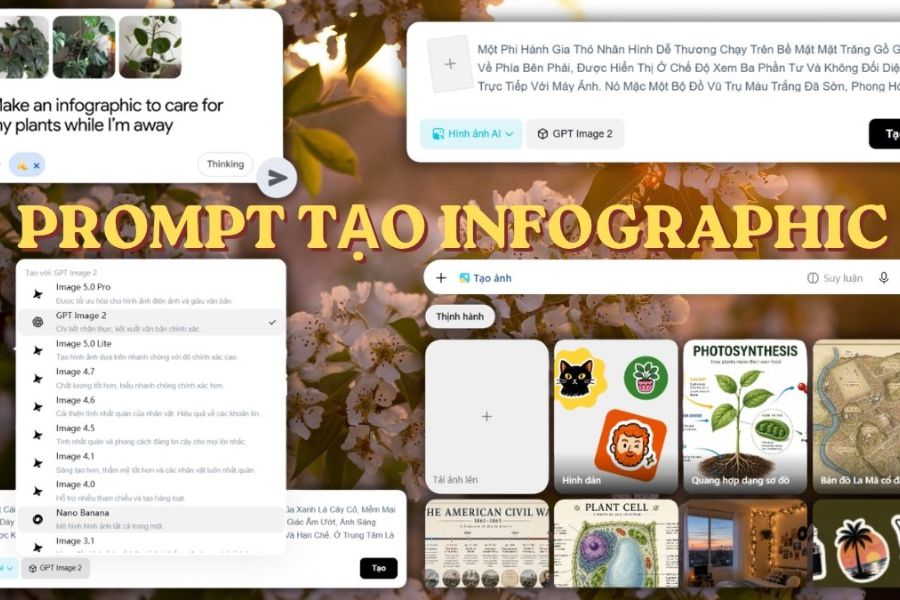
An effective prompt needs to clearly define five elements: subject, layout, design style, content to be displayed, and specifications. When requirements are specifically described, AI can more easily guide images according to their intended use, avoiding cluttered layouts or a lack of focus.
-
Subject: Define the main content, such as an educational infographic, financial report, or marketing strategy.
-
Layout: Choose a timeline, Bento Grid, mind map, or two-column comparison.
-
Style: Use flat vector graphics, 3D illustrations, minimalist design, or pastel colors.
-
Content: Specify the title, icons, figures, and main points to be included.
-
Specifications: Choose from 9:16, 4:5, or 16:9 aspect ratios depending on your intended use.
2. Templates for creating beautiful, professional infographics.
Below are 12 prompt templates categorized by common layout groups. You can copy the English commands, change the theme, and adjust the colors to suit your needs.
2.1. Process-based infographic prompt template
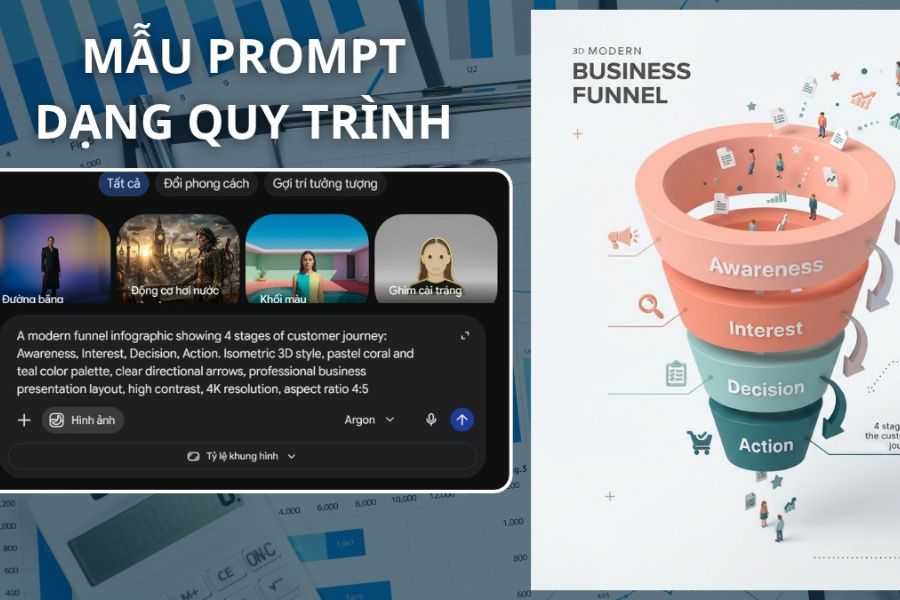
Process infographics use lines, arrows, or numbered buttons to show the sequence of actions. This design style is suitable for user manuals, recipes, work procedures, and personal care steps.
-
Quy trình phát triển phần mềm:
“Create a vertical timeline infographic illustrating a 5-step software development lifecycle, flat 2D vector style, connected blue dotted line, numbered circular nodes from 1 to 5, minimalist coding and testing icons, clean white background, balanced spacing, 9:16 aspect ratio.” -
Hành trình khách hàng trong marketing:
“Design a modern marketing funnel infographic showing four customer journey stages: Awareness, Interest, Decision, and Action. Use isometric 3D illustrations, pastel coral and teal colors, directional arrows, simple marketing icons, professional business layout, 4:5 aspect ratio.” -
Quy trình pha chế đồ uống:
“Generate a step-by-step cold brew coffee recipe infographic in four stages, warm vintage hand-drawn illustrations, cream background, coffee beans, glass carafe and timer icons, numbered steps, clean typography, 4:5 aspect ratio.” -
Chu trình chăm sóc da:
“Create a circular flow infographic showing a six-step evening skincare routine, minimalist line art, sage green and beige pastel palette, cosmetic bottle icons arranged clockwise, subtle arrows, clean background, balanced spacing, 4:5 aspect ratio.”
2.2. Infographic prompt template in comparison format
A comparative layout divides content into two or more sections to highlight the differences between objects. You can use contrasting colors, icons, and criteria lines to help viewers quickly grasp the information.
-
So sánh hai dòng điện thoại:
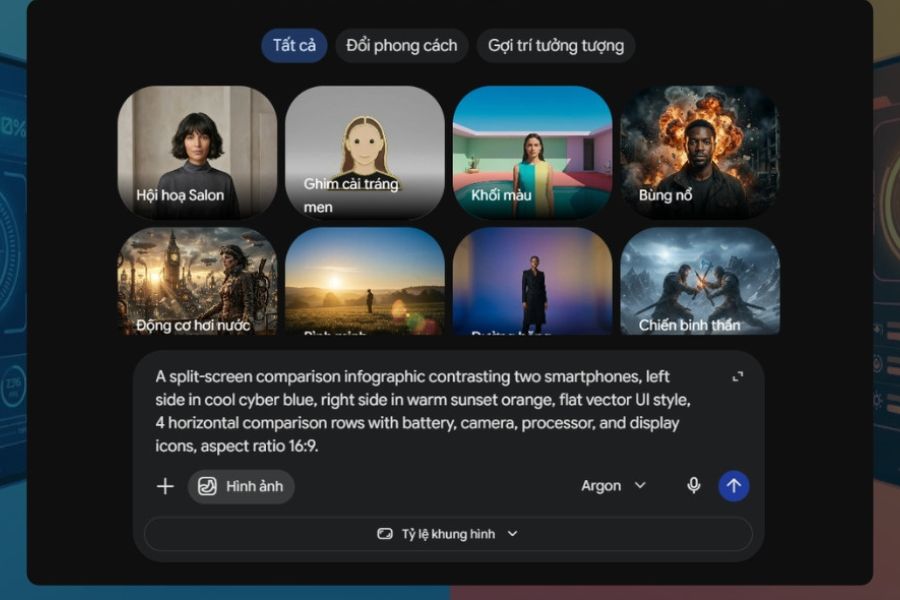
“Design a split-screen comparison infographic featuring two smartphones, cool cyber blue on the left and warm sunset orange on the right, four comparison rows for battery, camera, processor and display, flat vector icons, clean separators, modern technology style, 16:9 aspect ratio.” -
Đối chiếu ưu và nhược điểm:
“Create a professional two-column pros and cons infographic, green checkmark icons for advantages, red cross icons for disadvantages, light gray background, minimalist corporate design, geometric dividers, concise text areas, balanced white space, 4:5 aspect ratio.” -
So sánh trước và sau:
“Generate a before-and-after infographic showing a workspace transformation, cluttered desk in muted gray tones on the left, organized minimalist desk in warm bright colors on the right, isometric 3D illustrations, clear dividing line, consistent perspective, 16:9 aspect ratio.” -
So sánh các gói dịch vụ:
“Create a three-tier pricing infographic featuring Basic, Pro and Enterprise plans, clean UI card layout, subtle glassmorphism effects, soft gradient background, aligned pricing sections, simple feature icons, highlighted middle card, professional typography, 16:9 aspect ratio.”
2.3. Infographic prompt template for summarizing knowledge.
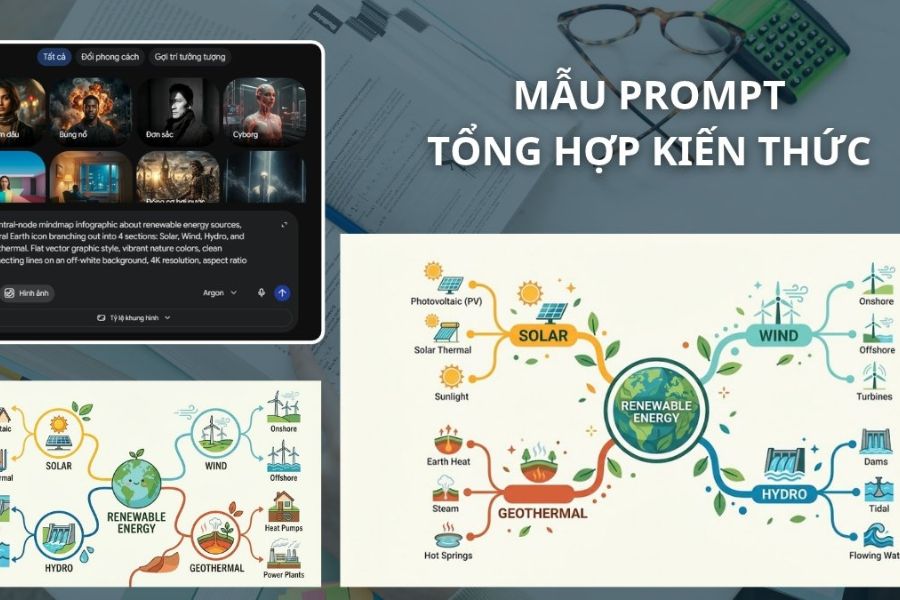
Comprehensive infographics often use grids, charts, or branching diagrams to present multiple groups of information within a single design. This is a suitable choice for statistical reports, lectures, educational content, and instructional materials.
-
Báo cáo thống kê thương mại điện tử:“Design a Bento Grid dashboard infographic summarizing annual e-commerce statistics, six modular cards featuring bar charts, a donut chart, sales growth indicators and customer metrics, dark mode UI, neon purple and cyan accents, clean layout, 16:9 aspect ratio.”
-
Sơ đồ tư duy về năng lượng tái tạo: “Create an educational mind map infographic about renewable energy, central Earth icon branching into Solar, Wind, Hydropower and Geothermal Energy, flat vector illustrations, vibrant nature colors, clean connecting lines, off-white background, 16:9 aspect ratio.”
-
Infographic thành phần dinh dưỡng: “Generate an educational nutrition infographic featuring an avocado in the center, surrounded by five callout boxes for key nutrients and their functions, watercolor and clean vector hybrid style, pastel green and yellow palette, simple food illustrations, balanced composition, 4:5 aspect ratio.”
-
Infographic quy tắc quản lý chi tiêu 50/30/20: “Create a personal finance infographic explaining the 50/30/20 budgeting rule, three proportional sections for Needs, Wants and Savings, piggy bank, shopping cart and house icons, modern flat vector style, navy blue and mustard yellow palette, clear percentage labels, 4:5 aspect ratio.”
3. How to use AI to create custom infographic prompts
If you're not familiar with writing commands in English, you can ask ChatGPT or Gemini to analyze the content and suggest a suitable prompt. This saves brainstorming time and makes it easier to experiment with different design styles.
-
Step 1: Access ChatGPT at https://chatgpt.com or Gemini at https://gemini.google.com and open a new chat.
-
Step 2: Paste the content you want to present, then ask the AI to act as an infographic design expert.
-
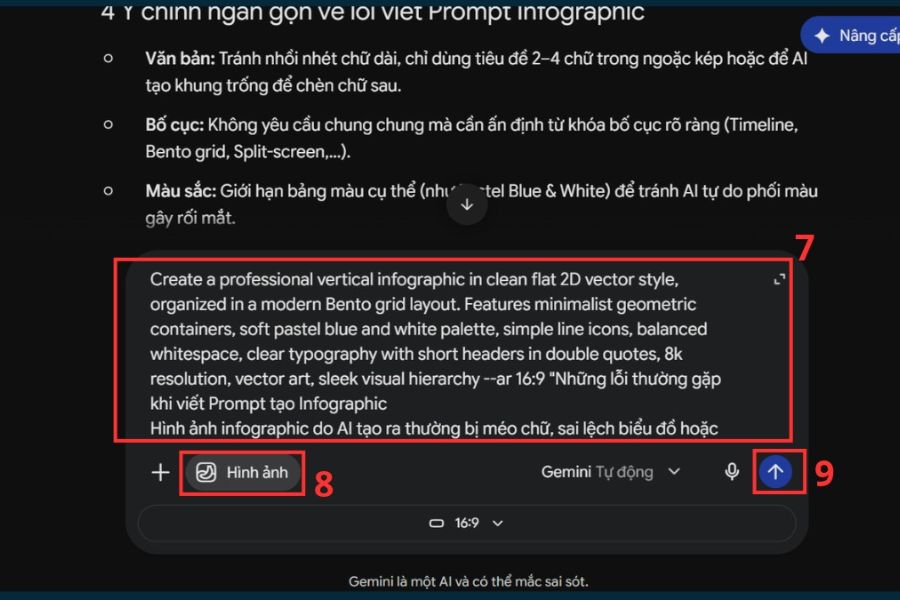
Step 3: Use the following command: “Based on the content I provide, select 4 main points, suggest a suitable infographic layout, and write a detailed English prompt in Flat 2D Vector style, Bento Grid layout, 9:16 aspect ratio. Prioritize concise, easy-to-read information and harmonious colors.”
-
Step 4: Review the suggested prompt and request adjustments if needed, such as changing to pastel colors, adding charts, or reducing the amount of detail.
-
Step 5: Copy the completed prompt into an image creation tool such as Ideogram or the built-in image creation feature on ChatGPT or Gemini. Then, check and edit the design before using it.
4. Common mistakes when writing prompts for creating infographics
Even with detailed instructions, you may still encounter typos, unbalanced layouts, or inappropriate colors. Identifying the errors below will help you improve your results more quickly.
-
Including too much text: Long content overwhelms the images and makes the text difficult to read. Keep it concise, focusing on the title, keywords, and main points; detailed text can be added later using Canva or Photoshop.
-
Without specifying the layout: A vague request can easily lead to the AI organizing information illogically. Clearly specify Timeline, Split-screen, Bento Grid, or Mind Map.
-
Using too many colors: An inconsistent color palette reduces the ability to understand information. You should limit yourself to about two to four main colors and choose colors that provide just enough contrast.
-
Ignore aspect ratio: Square images may not have enough space for a long workflow. Choose a 9:16 or 4:5 ratio for vertical content, and 16:9 for horizontal reports.
-
Failing to check output data: AI can generate inaccurate figures, chart labels, or text content. Compare information with the original source and manually edit before publishing.
5. Conclusion
With these 12 infographic design prompts, you can easily find suitable ideas for various purposes, from summarizing knowledge to business reports and social media communication. The key lies in clearly defining the content, choosing a suitable layout, and describing the style specifically enough. Start with a simple template, check the result, and then refine each element to create a visually appealing, easy-to-understand infographic with your own unique touch.





VIP Products

Best Selling Products
Freepik Premium Account
59 USD
Adobe Premiere Pro Account
99 USD
Genuine Cheap Canva Pro
39 USD
Capcut Pro 1 Year
39 USD
ChatGPT Plus Account (GPT-4)
16 USD
Adobe Photoshop Copyright - Full App
120 USD
Upgrade genuine Capture One account
120 USD
Copyright Adobe Lightroom Account
59 USD
Upgrade Genuine Office 365
49 USD
MidJourney Account
29 USD
Upgrade Duolingo Super
29 USD
Plugin Retouch4me
69 USD
Genuine Adobe Illustrator account
99 USD
Autodesk All App Account Copyright
120 USD
Windows 10 & 11 Pro Key
36 USD