Best Selling Products

Adobe Photoshop Copyright - Full App
120 USD

Freepik Premium Account
59 USD

Adobe Premiere Pro Account
99 USD

Copyright Adobe Lightroom Account
59 USD

Upgrade Duolingo Super
29 USD

Windows 10 & 11 Pro Key
36 USD

Genuine Adobe Illustrator account
99 USD

Capcut Pro 1 Year
39 USD
Upgrade Genuine Office 365
49 USD

MidJourney Account
29 USD

Plugin Retouch4me
69 USD

Upgrade genuine Capture One account
120 USD

ChatGPT Plus Account (GPT-4)
16 USD

Genuine Cheap Canva Pro
39 USD

Autodesk All App Account Copyright
120 USD
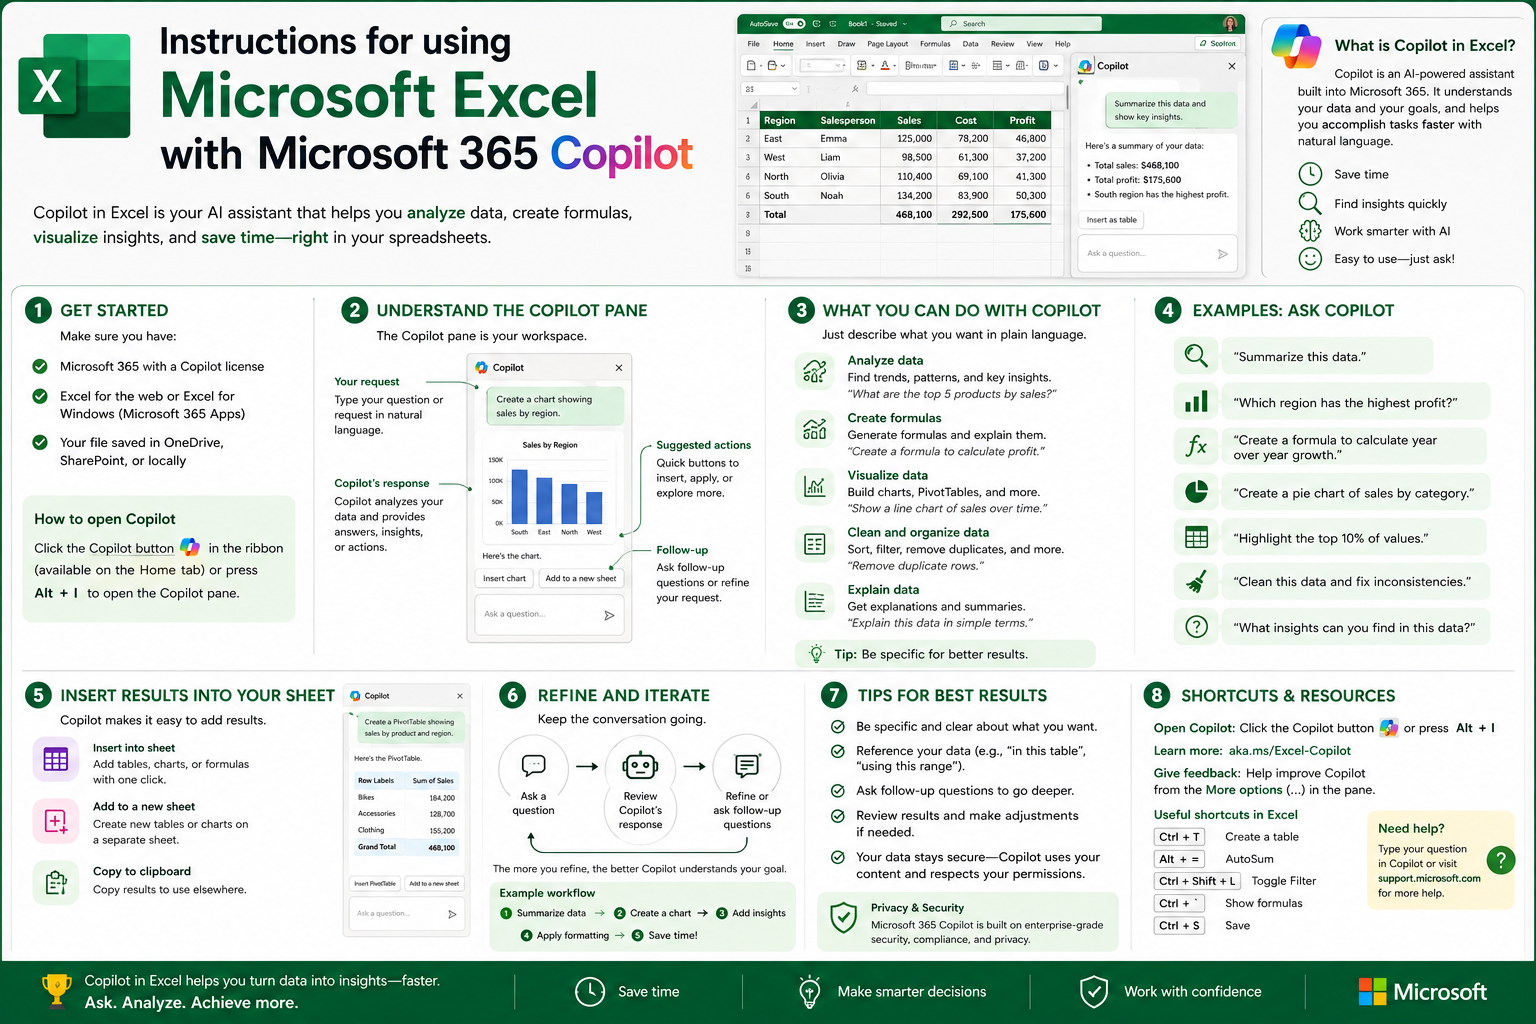
Instructions for using Microsoft Excel with Microsoft 365 Copilot
Nội dung
- 1. What is Microsoft Excel?
- 2. Transform data into insightful information.
- 3. Working online and collaborating
- 4. Analyzing data with Microsoft 365 Copilot
- 5. Edit Excel with Copilot
- 6. Find formulas faster with Copilot
- 7. Formatting data with Copilot
- 8. Data visualization
- 9. Automate tasks using formulas.
- 10. Work efficiently and control data.
Microsoft Excel makes it easy to import, manage, analyze, and visualize data in online spreadsheets.
1. What is Microsoft Excel?
Microsoft Excel is spreadsheet software within the Microsoft ecosystem, used for entering, storing, calculating, analyzing, and presenting data. Excel organizes information into rows and columns, where each cell can contain text, numbers, dates, formulas, or other types of data.
Excel's strength lies in its ability to handle a wide variety of tasks within a single spreadsheet. Users can create personal budgets, manage revenue, track inventory, build business reports, analyze sales data, or create visual charts.
Excel also supports many functions and formulas, helping users automate calculations instead of performing them manually. When the data changes, the results of the relevant formulas can be updated accordingly.
2. Transform data into insightful information.
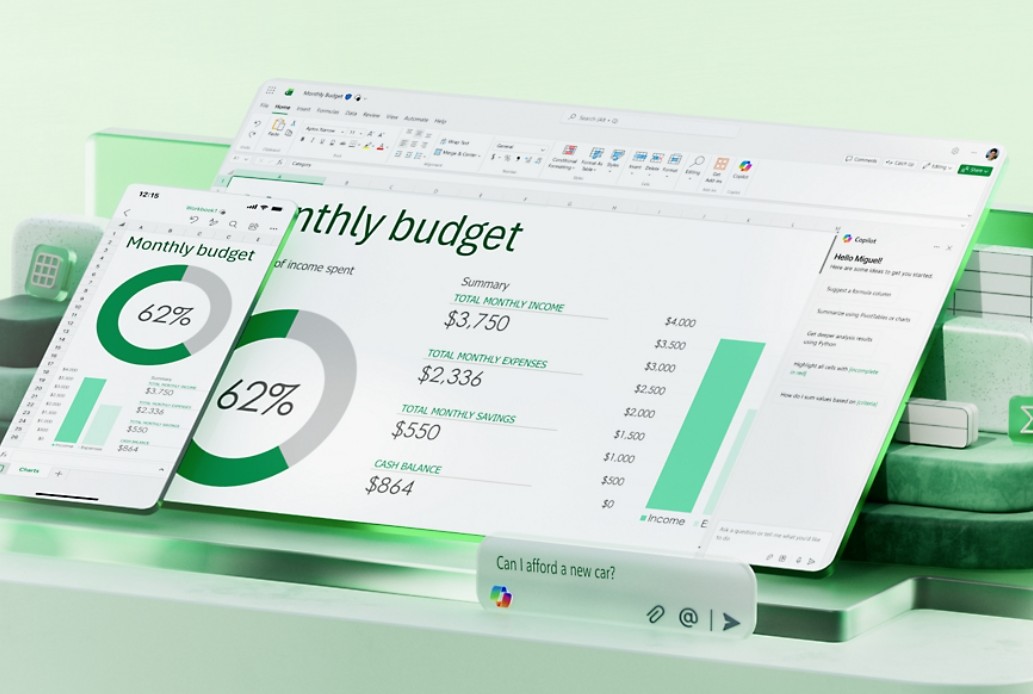
A large data table can contain a lot of information, but it's not always easy to understand. Excel helps users process data to find trends, anomalies, and important insights.
For example, a business might track revenue by day, product, and employee. Looking at thousands of lines of data, determining which products sell best or which months have the highest revenue would be incredibly time-consuming.
Excel allows you to use formulas, filters, summary tables, and charts to transform raw data into more easily analyzeable information.
A basic formula for calculating total revenue could be:
=SUM(D2:D100)
In this process, Excel will add up all the values from cell D2 to D100 .
If you want to calculate average revenue, you can use:
=AVERAGE(D2:D100)
With larger datasets, users can combine multiple functions to build more complex calculations.
3. Working online and collaborating
One of the key changes in modern Excel is its ability to work online and collaborate. Instead of each person keeping a separate version of a spreadsheet on their computer, multiple people can work together on a single file stored online.
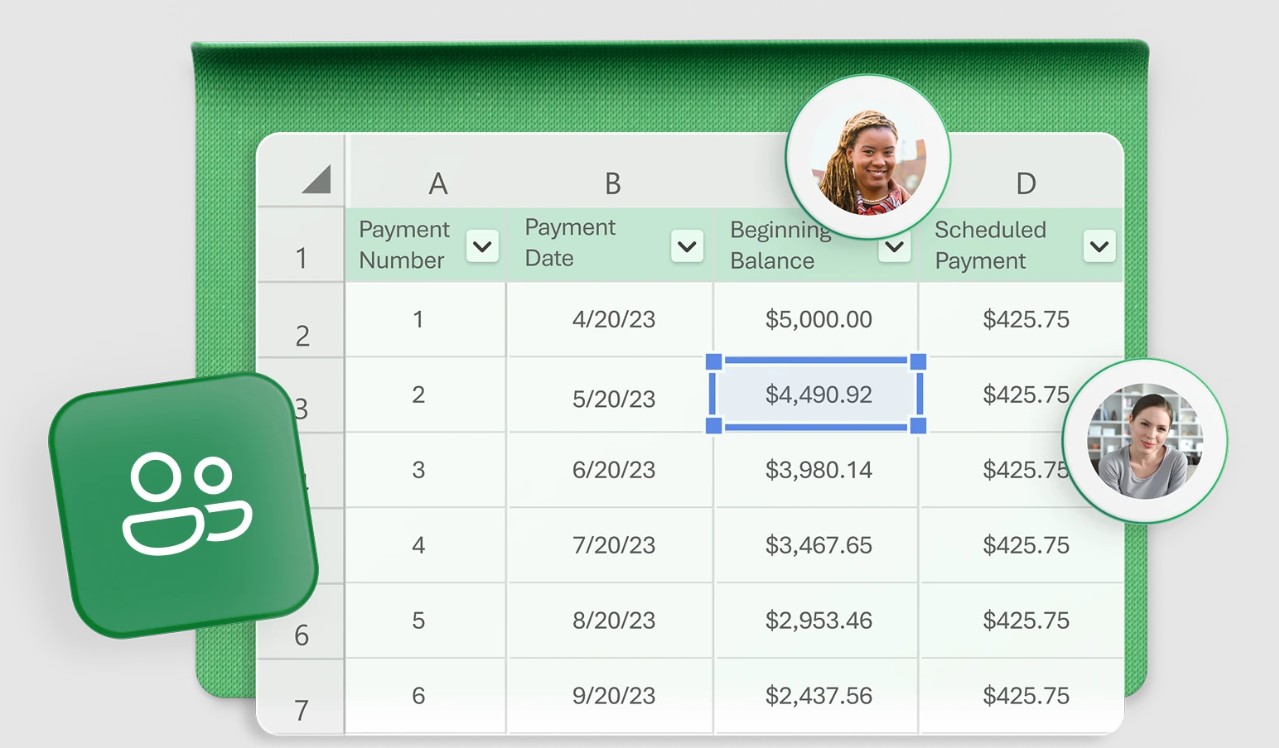
This is especially useful for remote teams or projects that require multiple people to update data simultaneously. When one member edits a spreadsheet, the changes can be synchronized so that other members can continue working on the latest version.
The basic collaboration process can be implemented as follows:
Step 1: Open the Excel spreadsheet you want to share.
Step 2: Save the file to a supported online location within the Microsoft ecosystem.
Step 3: Select the Share option to share the spreadsheet.
Step 4: Enter the email addresses of the people you want to access.
Step 5: Set appropriate access permissions, such as allowing others to edit or only view.
Step 6: Send invitations to share.
Once granted permission, participants can access the spreadsheet and work with it according to the established rules.
Collaboration capabilities help prevent situations where each person uses a different version of Excel, thereby reducing the risk of data being scattered or using outdated versions by mistake.
4. Analyzing data with Microsoft 365 Copilot
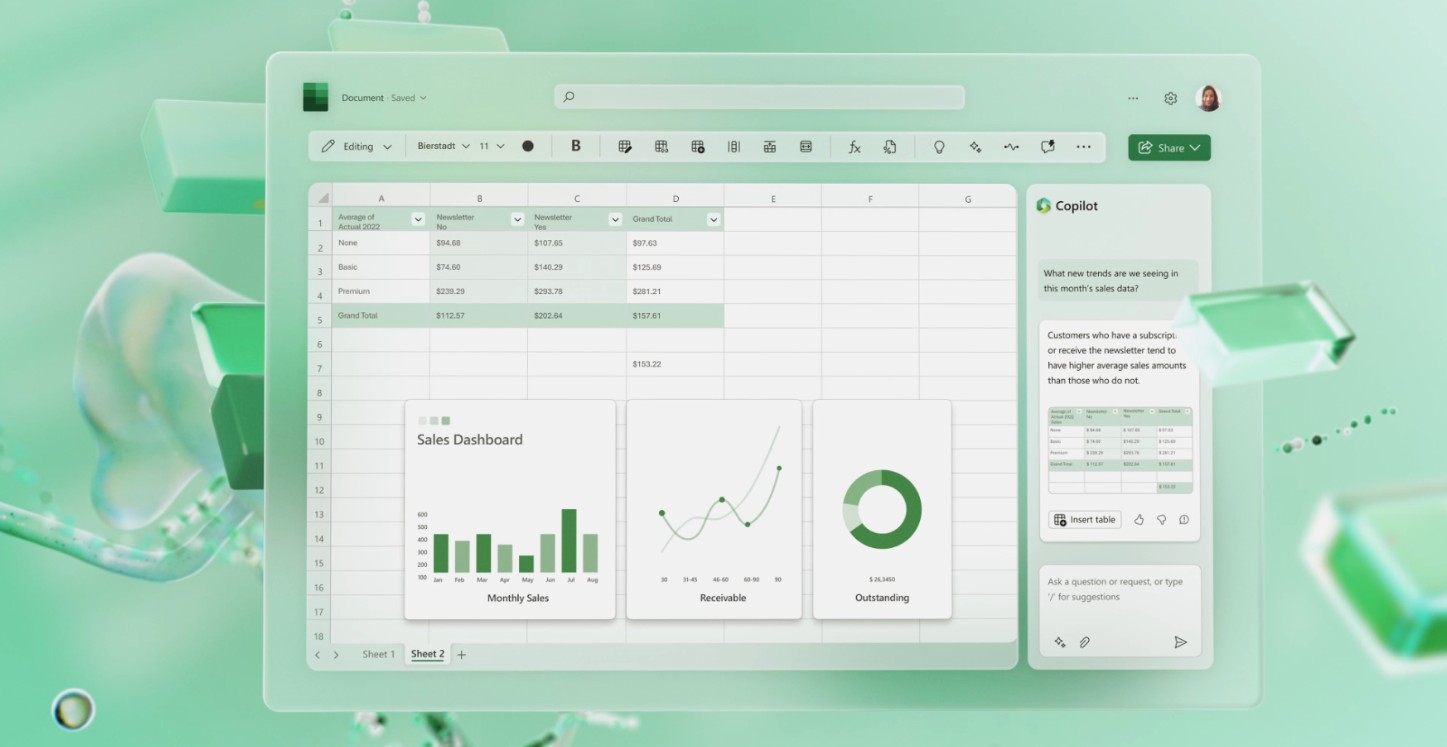
Microsoft 365 Copilot in Excel provides AI-powered support for many data processing tasks. Instead of having to remember every formula precisely or perform every operation manually, users can describe their requirements using natural language.
Copilot can assist with everything from simple spreadsheet creation to more advanced data analysis tasks. This is especially helpful for users who are not very familiar with Excel formulas.
For example, instead of building a complex formula themselves, users can ask Copilot:
"Calculate the total revenue for each product and identify the product with the highest revenue."
Copilot can assist users in finding appropriate ways to process data. However, the results suggested by AI should still be vetted before being used in reporting or business decisions.
5. Edit Excel with Copilot
One of Copilot's notable capabilities is its support for on-demand spreadsheet editing using natural language.
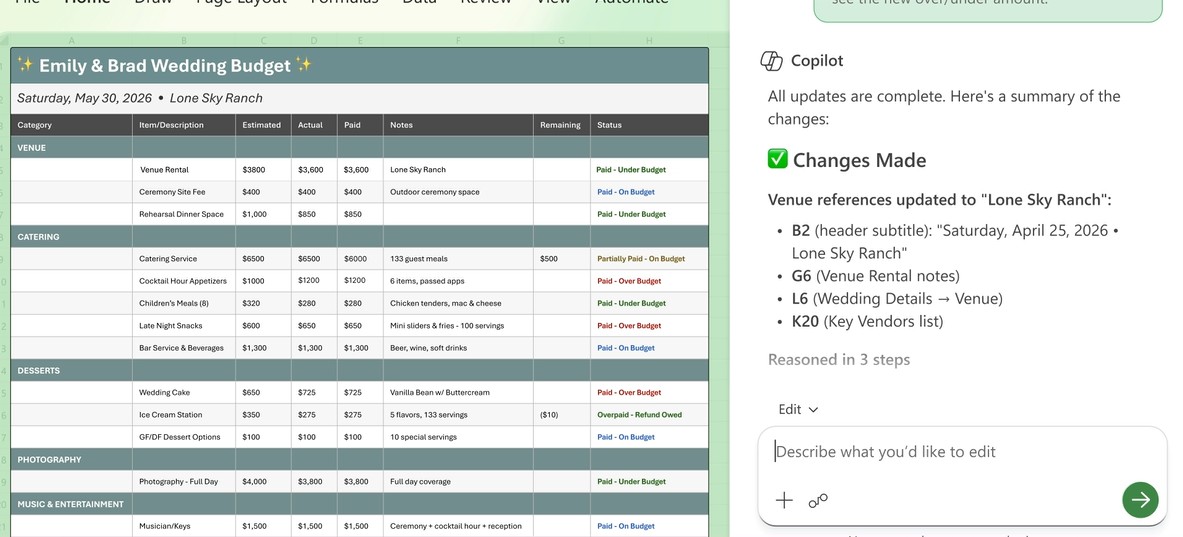
Users can describe the desired changes instead of having to perform each step manually. For example:
"Add a column to calculate total revenue."
Or:
"Format the table so the headings are easier to read."
Copilot can assist in making changes related to formulas, tables, or formatting. After the proposed or implemented changes are made, users can review the results.
The key point is that Copilot doesn't completely replace user control. Users still need to review changes before accepting them, especially when the spreadsheet contains critical data.
The usage process can be carried out as follows:
Step 1: Open the spreadsheet containing the data you want to edit.
Step 2: Accurately identify the data or table you want to change.
Step 3: Open Copilot in Excel if this feature is available with your Microsoft 365 account and version.
Step 4: Enter a specific request, for example: "Add a column to calculate total revenue by multiplying the quantity by the unit price."
Step 5: Review Copilot's proposal.
Step 6: Check the formula and results before accepting the changes.
This approach saves users time while maintaining control over their data.
6. Find formulas faster with Copilot
Formulas are one of the most important components of Excel, but they can also be a challenge for beginners. There are hundreds of functions serving various needs, from summing and averaging to searching, handling conditions, and analyzing data.

Copilot can help users find the right formula by describing the desired outcome.
For example, you have a sales table and want to identify the rows with revenue exceeding 10 million VND. Instead of memorizing the function syntax yourself, you can use Copilot:
"Create a formula to identify orders with revenue greater than 10,000,000 and return 'High' if true, 'Low' if false."
A corresponding Excel formula might be:
=IF(D2>10000000,"High","Low")
In this case, D2 is the cell containing the revenue. If the value is greater than 10,000,000 , Excel returns "High" ; otherwise, the result is "Low" .
For more complex requests, users can describe specific goals so Copilot can help find solutions.
7. Formatting data with Copilot
Formatting not only makes spreadsheets look better but also helps readers quickly identify important information.

A data table containing hundreds or thousands of rows would be difficult to follow if all the cells had the same display style. Excel offers many formatting tools, while Copilot can help users make several changes based on their needs.
For example, a user might request:
"Highlight the product lines with sales exceeding 50,000,000."
Or:
"Add a new column to categorize customers by revenue."
Copilot can assist with everything from adding columns to highlighting important information. Users can then review the results to ensure the formatting is appropriate for their needs.
8. Data visualization
One of the most effective ways to understand data is through visualization. Instead of just reading numbers, users can use charts to identify trends and compare groups of data.
Excel supports many chart types, including bar charts, line charts, pie charts, and various other visualization styles. The choice of chart type should depend on the type of data and information you want to convey.
For example, a bar chart is suitable when you need to compare revenue across multiple products. A line chart is more suitable when you want to track revenue changes over time.
The basic process for creating a chart includes:
Step 1: Prepare a data table with clear column headers.
Step 2: Select the data range you want to visualize.
Step 3: Select Insert from the toolbar.
Step 4: Choose the appropriate chart type.
Step 5: Check the chart title, data labels, and axes.
Step 6: Adjust the formatting to make the chart easy to read.
When combined with charts, formulas, and analytical tools, Excel can transform data tables into more visual and understandable reports.
9. Automate tasks using formulas.
Excel can significantly reduce repetitive tasks through formulas. Instead of calculating each row individually, users only need to build the formula once and then apply it to the remaining rows.
For example, if column B contains the quantity and column C contains the unit price, the formula for calculating the total amount in cell D2 could be:
=B2*C2
The formula can then be applied to the following lines.
For large datasets, this method helps reduce errors and save time. When quantities or unit prices change, the results can also be updated according to the formula.
10. Work efficiently and control data.
Even with Copilot's support, users should still understand the data structure and verify the results. AI can help suggest formulas or methods, but it should not be considered an absolute guarantee of accuracy.
A professional spreadsheet should have clear headings, consistent data, and checked formulas. Columns should have a specific purpose, avoiding mixing unrelated data types in the same field.
When using Copilot, be specific with your request. Instead of writing:
"Analyze this data."
Can you be more specific?
"Analyze monthly revenue, identify the month with the highest and lowest revenue, and outline the trend in revenue."
The clearer the requirements, the easier it is to verify and apply the support results to the work.
When used correctly, Excel can help transform complex data tables into easily understandable information, supporting more effective analysis and decision-making. This is the core value of Excel: not just storing data, but helping users better understand, analyze, and utilize that data.



















VIP Products








Best Selling Products
Adobe Photoshop Copyright - Full App
120 USD
Freepik Premium Account
59 USD
Adobe Premiere Pro Account
99 USD
Copyright Adobe Lightroom Account
59 USD
Upgrade Duolingo Super
29 USD
Windows 10 & 11 Pro Key
36 USD
Genuine Adobe Illustrator account
99 USD
Capcut Pro 1 Year
39 USD
Upgrade Genuine Office 365
49 USD
MidJourney Account
29 USD
Plugin Retouch4me
69 USD
Upgrade genuine Capture One account
120 USD
ChatGPT Plus Account (GPT-4)
16 USD
Genuine Cheap Canva Pro
39 USD
Autodesk All App Account Copyright
120 USD