Best Selling Products
Upgrade genuine Capture One account
120 USD

Copyright Adobe Lightroom Account
59 USD

Upgrade Duolingo Super
29 USD
Adobe Photoshop Copyright - Full App
120 USD

ChatGPT Plus Account (GPT-4)
16 USD
Plugin Retouch4me
69 USD

Freepik Premium Account
59 USD

MidJourney Account
29 USD
Autodesk All App Account Copyright
120 USD
Upgrade Genuine Office 365
49 USD
Genuine Cheap Canva Pro
39 USD

Windows 10 & 11 Pro Key
36 USD

Capcut Pro 1 Year
39 USD
Adobe Premiere Pro Account
99 USD
Genuine Adobe Illustrator account
99 USD
Steps to Designing Beautiful and Engaging Infographics
Nội dung
- 1. What is an Infographic?
- 2. The Role of Infographics in Marketing
- 3. Benefits of Infographics
- 4. Important Elements That Make Up an Infographic
- 4.1 Skimmability
- 4.2 Using Metaphors
- 4.3 Creating Slides
- 4.4 Beautiful Data
- 4.5 Using Bar Graph Charts
- 4.6 Using Copies
- 4.7 Telling a Visual Story
- 4.8 Be Careful When Using Comparison Images
- 5. Steps to Designing an Impressive Infographic
- 5.1 Step 1: Identify the Infographic Topic
- 5.2 Step 2: Come Up with Implementation Ideas
- 5.3 Step 3: Collect and Select Information
- 5.4 Step 4: Tell a Powerful Story
- 5.5 Step 5: Proceed to Design the Infographic
- 5.6 Step 6: Present Visual Data
- 5.7 Step 7: Ask for Everyone’s Opinions
- 5.8 Step 8: Promote and Share
- 6. Conclusion
In today’s digital technology era, infographics have become a powerful tool for conveying information effectively and attractively. A beautiful infographic not only helps viewers easily receive information but also creates a deep impression, making them remember the content longer. However, to design an engaging infographic, you need to go through many steps, from coming up with ideas, choosing colors, to arranging a reasonable layout. In this article, let’s explore with Appvip the steps to designing beautiful infographics, from basic principles to optimization tips to improve aesthetics and the effectiveness of message delivery.
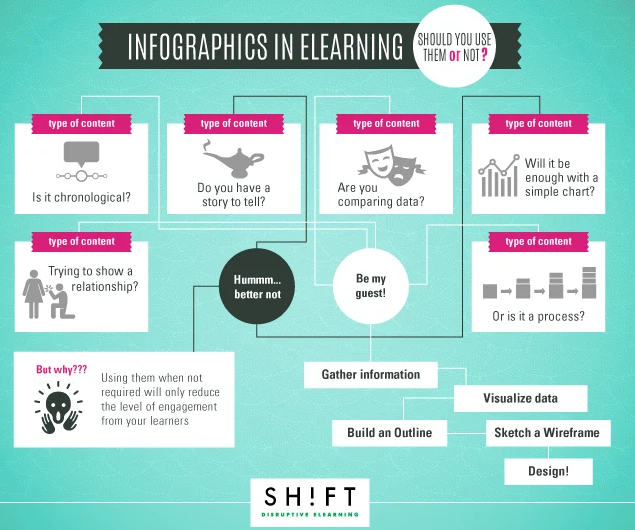
1. What is an Infographic?
Infographic, a compound word between "Information" and "Graphic", is a sophisticated combination of information and images to convey content in a visual and vivid way. Instead of only using text to describe, infographics use icons, images, and eye-catching colors to turn complex information into easy-to-understand and easy-to-remember parts. This helps viewers grasp content more quickly and effectively, especially in an era where readers’ time and attention are extremely valuable.
This form not only makes information more attractive but also increases memorability. We often tend to remember images better than written text. When a concept is illustrated with images and charts, the ability of viewers to understand and remember that information will be much higher. Infographics have become an indispensable tool in conveying knowledge, from education to marketing.
The strong development of infographics over the past decade has proven their important role in communication. In classrooms, workplaces, or right on websites, infographics contribute to creating deeper interaction and understanding between the communicator and the information recipient. This is the very reason why infographics have become a design trend that cannot be ignored.
.png)
2. The Role of Infographics in Marketing
In the field of marketing, infographics are currently considered one of the leading trends in Content Marketing. Consumers increasingly prefer concise, brief content that is presented in a visual and unique way. Infographics perfectly meet this need by helping brands convey messages quickly without making viewers feel bored.
Instead of having to read a lengthy advertisement, users may only need to look at an infographic to understand all the necessary information. This not only saves time but also improves communication effectiveness. An attractive infographic design can capture attention at first glance, stimulate curiosity, and encourage viewers to learn more about the product or service.
Moreover, with the ability to be easily shared on social media platforms, infographics help increase reach and interaction with the target audience. This is very important in building a brand and creating long-term relationships with customers. By using infographics, marketers can create unique content, make a strong impression, and easily spread it to the community.
3. Benefits of Infographics
Infographics bring many outstanding benefits not only to designers but also to viewers. First, with a simplified presentation method, information becomes easier to understand and remember. Viewers no longer feel bored when facing a large amount of text, but instead see lively images and icons that help them absorb content naturally and interestingly.
Second, infographics help arrange information in a scientific and coherent way, minimizing the possibility of misunderstanding. When elements are organized reasonably, viewers can easily follow and identify key points without being distracted. This is especially important in education and communication, where clarity and accuracy are extremely important.
Finally, with their easy-to-share and spreadable nature, infographics do not stop at conveying information but also create opportunities for interaction and connection between the communicator and the recipient. This is why many organizations, from businesses to nonprofit organizations, choose infographics as an effective tool to raise awareness and interact with the public.
.png)
4. Important Elements That Make Up an Infographic
To create an impressive and effective infographic design, you need to master several important elements. These elements not only help you convey information clearly but also make the infographic more attractive and easier for viewers to understand. Below are the elements to pay attention to:
4.1 Skimmability
One of the main goals of an infographic is to help viewers easily access complex information without feeling overwhelmed. Skimmability is a key factor in infographic design. When users only need to skim through it, they can grasp more than 90% of the message you want to convey. To achieve this, you need to use a clear presentation method, combined with vivid illustrative images and important highlights. Instead of a large amount of text, prioritize using concise titles, charts, and images to highlight core information.
4.2 Using Metaphors
Metaphors are a powerful tool in infographic design. Instead of only presenting numbers dryly, you can use images and icons to create visual connections. For example, if you are reporting revenue growth, instead of only giving numbers, visualize it through the image of growing trees. This not only makes the information more vivid but also helps viewers easily understand and remember the content better.
4.3 Creating Slides
Infographics are not simply static images. Using 3D images or slides can create a more interactive experience for viewers. These slides can explain, add information, and help readers easily follow the flow of the message. When designing, consider dividing information into smaller sections, each of which can be a separate slide, creating an engaging visual story.
.png)
4.4 Beautiful Data
An effective infographic is not simply about presenting data but must also make that data beautiful and easy to understand. The way you process and present data will determine how users receive information. Imagine data as artistic puzzle pieces, arranged harmoniously and attractively. Use different colors, shapes, and sizes to highlight important elements, helping viewers easily grasp the core content from the first glance.
4.5 Using Bar Graph Charts
Bar Graph is one of the most popular tools in infographic design. However, to create your own impression, you need to be creative and innovative in the way you present it. Instead of only using regular bar charts, try experimenting with more unique forms, such as circular charts or 3D charts, to create a difference. This not only attracts attention but also helps viewers easily compare and analyze data.
4.6 Using Copies
Copies are an important element that helps infographics display more data in different contexts. Using copies reasonably not only helps minimize space but also creates consistency in design. Make sure that the copied elements are presented clearly, helping viewers easily follow and understand the information you want to convey.
.png)
4.7 Telling a Visual Story
A successful infographic is not simply about presenting information but must also tell a story. Each part of the infographic should be designed to guide viewers through a journey, from the starting point to the ending point. Use software such as After Effects or Illustrator to create motion or interactive elements, helping viewers feel the story in a more vivid and interesting way.
4.8 Be Careful When Using Comparison Images
Comparing data is a very important part of infographics, but you need to be careful in how you do it. Use charts, graphs, or images to convey comparison information clearly and understandably. Make sure that the image you choose is not only illustrative but also helps viewers immediately recognize the difference and correlation between the data.
5. Steps to Designing an Impressive Infographic
5.1 Step 1: Identify the Infographic Topic
The first and also the most important step in the infographic design process is to clearly identify the topic you want to convey. The topic is not only the title of the infographic but also the core message you want readers to remember. Choosing a suitable and attractive topic will help you easily visualize related elements such as design style, colors, and necessary content for the infographic.
Once you have the topic in hand, you will feel that developing design ideas becomes much simpler. Instead of wandering in a sea of information, you will have a clear direction, helping you focus on creating a complete and highly attractive product.
5.2 Step 2: Come Up with Implementation Ideas
After identifying the topic, the next step is to come up with implementation ideas. This is the stage where you can roughly sketch the layout of the infographic, then select suitable data, images, and words. A detailed plan will help you avoid confusion during the design process, especially when you want to build a video-style infographic or landing page.
Imagine how you want viewers to interact with your infographic. You can list the elements that will appear in the design, from images to charts, to ensure that everything is connected and serves the overall message.
5.3 Step 3: Collect and Select Information
Once you have a clear idea, the next step is to collect and select information. Searching for data from reliable sources such as books, newspapers, and reputable websites will help you obtain accurate and useful information. Remember that the information you choose must be suitable for the topic and idea you have previously developed.
Careful selection of information will help create an infographic that is not only unique but also highly valuable. Do not hesitate to remove unnecessary data, because a successful infographic is not a contest of information quantity but of quality and presentation method.
5.4 Step 4: Tell a Powerful Story
An impressive infographic is not simply about presenting information but must also tell a story. Imagine how you want to guide viewers through each part of the infographic. Each section should be built like a story with a clear introduction, body, and conclusion.
An engaging introduction will attract viewers’ attention right from the beginning, while the conclusion needs to summarize all information neatly and impressively. A powerful story will help readers not only understand but also remember the message you want to convey.
.png)
5.5 Step 5: Proceed to Design the Infographic
Once everything is prepared, now is the time for you to proceed with designing the infographic. Color is the leading important element in design. Carefully consider how to use colors not only to highlight information but also to create harmony for the overall design.
If you are designing an infographic in video form, then sound, images, and effects also need to be focused on. Ensure that your output quality is as high as possible, because even a sophisticated design with low quality will reduce the value of the message.
5.6 Step 6: Present Visual Data
When designing infographics, many people often focus only on the graphic part and forget that information is equally important. Make sure that the data you present is accurate and easy to understand. Investing time in learning and checking information will help increase the credibility of your infographic.
Through visual presentation, viewers will easily access and understand the content you want to convey. Remember that the ultimate goal is to help readers quickly grasp information without feeling overwhelmed.
5.7 Step 7: Ask for Everyone’s Opinions
If you have difficulty in designing, do not hesitate to seek help from others. You can look for opinions from people with experience in the field of graphic design or from friends. Different perspectives will help you improve and complete your infographic better.
Make sure that the people you consult have basic knowledge of graphics, so they can give useful comments that are suitable for your goals.
5.8 Step 8: Promote and Share
After completing the infographic, this is the time to bring your product to the world. Do not rely only on search engines to attract viewers; make the most of social media platforms such as Facebook, Twitter, and especially Pinterest.
Sharing the infographic with an attractive caption and the right hashtags will help improve reach and attract a large amount of traffic to your website. Don’t forget to monitor feedback from viewers so you can adjust and improve for the next projects!
.png)
6. Conclusion
Infographic design is not simply creating eye-catching images but also the art of combining information and visuals. Through the steps presented, you can create products that are not only beautiful but also have high communication value. In particular, Photoshop Adobe is the perfect tool for creating Infographics. If you need an upgrade, contact Appvip now to receive detailed consultation and enjoy many other preferential policies!

















VIP Products



Best Selling Products
Upgrade genuine Capture One account
120 USD
Copyright Adobe Lightroom Account
59 USD
Upgrade Duolingo Super
29 USD
Adobe Photoshop Copyright - Full App
120 USD
ChatGPT Plus Account (GPT-4)
16 USD
Plugin Retouch4me
69 USD
Freepik Premium Account
59 USD
MidJourney Account
29 USD
Autodesk All App Account Copyright
120 USD
Upgrade Genuine Office 365
49 USD
Genuine Cheap Canva Pro
39 USD
Windows 10 & 11 Pro Key
36 USD
Capcut Pro 1 Year
39 USD
Adobe Premiere Pro Account
99 USD
Genuine Adobe Illustrator account
99 USD