Best Selling Products

Adobe Premiere Pro Account
99 USD
Plugin Retouch4me
69 USD

Genuine Adobe Illustrator account
99 USD

MidJourney Account
29 USD

Freepik Premium Account
59 USD

Upgrade Duolingo Super
29 USD
Autodesk All App Account Copyright
120 USD

Copyright Adobe Lightroom Account
59 USD
Windows 10 & 11 Pro Key
36 USD
Genuine Cheap Canva Pro
39 USD

ChatGPT Plus Account (GPT-4)
16 USD
Adobe Photoshop Copyright - Full App
120 USD
Upgrade Genuine Office 365
49 USD
Capcut Pro 1 Year
39 USD
Upgrade genuine Capture One account
120 USD
Discover Smart AI Tools in Canva Sheets
Nội dung
- 1. What is AI Data Analysis?
- 2. What is Magic Insights?
- 3. Why is AI Data Analysis becoming increasingly important?
- 4. Discover Magic Insights from your data
- 4.1. Automatic trend detection
- 4.2. Intelligent Data Summarization
- 4.3. Understanding the meaning behind the numbers
- 5. Analyze data in just seconds.
- 6. No need to know complicated formulas.
- 7. Transform data into a visual story.
- 8. Import data into all Canva designs.
- 9. Do more with Magic Formulas
- 10. Visualize data with Magic Charts
- 11. Conclusion
Canva introduced Canva Sheets along with a host of intelligent AI features such as Magic Charts, Magic Formulas, and Magic Insights. These tools not only help process data efficiently but also create a strong connection between data and visual design.
1. What is AI Data Analysis?
AI Data Analysis is the process of using artificial intelligence and machine learning algorithms to automatically analyze, detect trends, find correlations, and extract valuable insights from data. Instead of manually processing thousands of data lines, AI can perform this task in just seconds.
The development of visual platforms like Canva has made this technology more accessible to all users. One of the standout tools is Magic Insights (Pro), an AI data analysis solution integrated into Canva Sheets.
Magic Insights allows users to quickly uncover important information hidden within data tables, transforming dry numbers into intuitive charts and easy-to-understand summaries.
As a result, data analysis is no longer a task reserved only for data experts or professional analysts, but has become a decision-making tool for individuals and businesses alike.

2. What is Magic Insights?
Magic Insights is an AI-powered data analysis tool integrated directly into Canva Sheets.
This tool is designed to help users quickly understand the meaning behind numbers by automatically scanning data, identifying trends, detecting patterns, and presenting results in a visual format.
Typically, when working with spreadsheets containing hundreds or thousands of rows of data, finding useful information can take hours. Users have to build formulas, create charts, and perform various analytical steps.
Magic Insights simplifies that entire process.
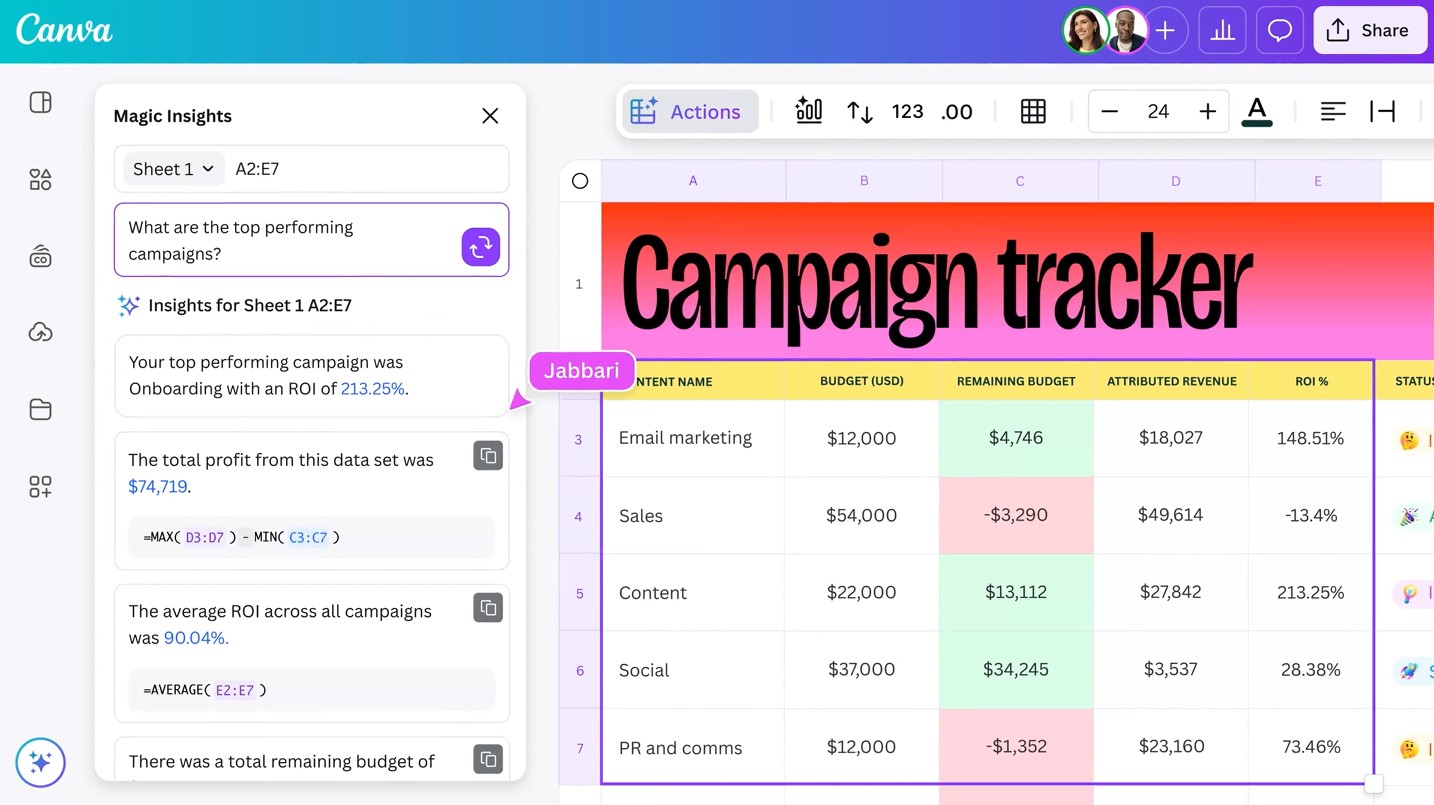
After selecting the dataset and asking questions in natural language, the AI will perform the analysis and provide:
-
Key findings
-
Outstanding trends
-
Data summary
-
Visual chart
-
Suggested actions
This helps users save a significant amount of time and resources.
3. Why is AI Data Analysis becoming increasingly important?
Data is growing at an unprecedented rate.
According to numerous studies, billions of gigabytes of data are generated worldwide every day from websites, applications, social networks, CRM systems, ERP software, and many other sources.
Manually processing this volume of data is virtually impossible.
AI Data Analysis helps solve the problem by:
-
Increase data processing speed
-
Discovering hidden trends
-
Reduce human error.
-
Automating the analysis process
-
Supporting more accurate decision-making.
For modern businesses, the ability to effectively leverage data is a crucial competitive advantage.
Businesses that understand their customers better, identify market opportunities faster, and make data-driven decisions are often able to outperform their competitors in terms of growth.
4. Discover Magic Insights from your data
One of the biggest challenges when working with data is knowing where to start. Many people have spreadsheets with hundreds of columns of data but don't know which information is important to focus on for analysis. Magic Insights is designed to solve this very problem.
4.1. Automatic trend detection
Instead of requiring users to manually check each data column, AI will automatically scan the entire dataset and identify prominent trends.
For example:
-
In which month did revenue increase significantly?
-
Which customer group generates the highest sales?
-
Which areas are experiencing rapid growth?
-
Which product has a high conversion rate?
This information is presented in an easy-to-understand format, helping users quickly grasp the overall picture.
4.2. Intelligent Data Summarization
A large spreadsheet can be overwhelming for users.
Magic Insights uses AI to transform complex data into concise yet meaningful summaries.
Instead of reading thousands of lines of data, users only need to see the key conclusions generated by the AI.
4.3. Understanding the meaning behind the numbers
Numbers are only truly valuable when interpreted correctly.
Magic Insights not only displays data but also helps users understand what's happening and why it matters.
This is the key difference between "seeing the data" and "understanding the data".
5. Analyze data in just seconds.
One of the biggest advantages of AI Data Analysis is speed.
Typically, the data analysis process can take many hours or even days for large datasets.
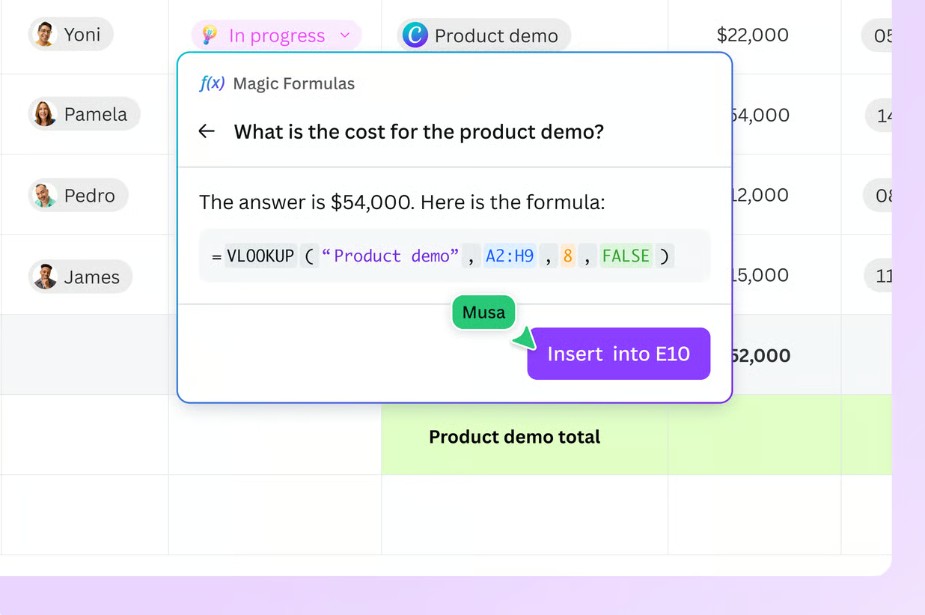
With Magic Insights, users simply ask questions using natural language.
For example:
-
Which month had the highest sales?
-
Which region is experiencing the fastest growth?
-
Which product is selling best?
-
Which customer group generates the most revenue?
AI will automatically process the data and provide answers almost instantly.
This helps businesses save significant time in report generation and decision-making.
6. No need to know complicated formulas.
One of the major barriers to traditional data analysis is the requirement for specialized knowledge.
Users typically need to be proficient in:
-
Excel
-
Google Sheets
-
Statistical function
-
Pivot Table
-
Data Visualization
Magic Insights completely transforms this experience.
Instead of using complex formulas, users can simply ask questions as if they were having a conversation with a data analyst.
For example:
"Tell me which customer group generated the most revenue in the past quarter."
AI will understand the request, analyze the data, and provide relevant results.
This enables everyone, even those without a technical background, to effectively leverage data.
7. Transform data into a visual story.
Data becomes more valuable when presented in visual form.
Charts make it easier for viewers to identify trends and relationships between data compared to traditional tables.
Magic Insights can automatically generate charts that are appropriate for the data being analyzed.
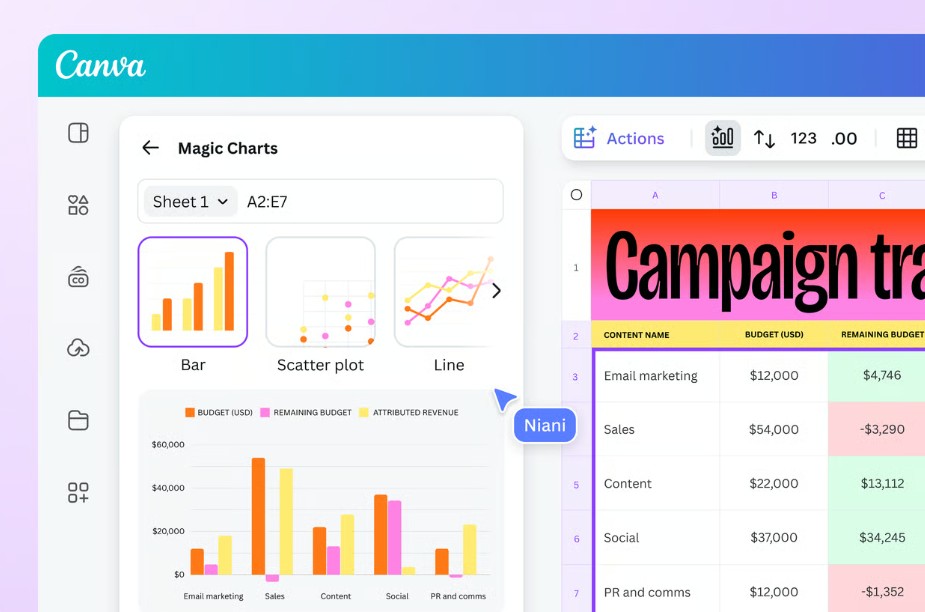
Users can quickly create:
-
Bar chart
-
Line graph
-
Pie chart
-
Trend chart
-
Comparison chart
As a result, the data becomes more visual, easier to understand, and more engaging.
8. Import data into all Canva designs.
One of the standout features of Magic Insights is its ability to integrate directly with the Canva ecosystem.
After creating a chart or data summary, users can insert it directly into:
-
Presentation
-
Business Report
-
Infographic
-
Social media content
-
Training materials
-
Internal Dashboard
Combining data with design enhances the persuasiveness and professionalism of content.
This is a significant advantage, especially for managers, marketers, and consultants, when presenting results to clients or senior management.
9. Do more with Magic Formulas
In addition to Magic Insights, Canva Sheets also integrates Magic Formulas.
This is a tool that helps create recipes automatically using AI.
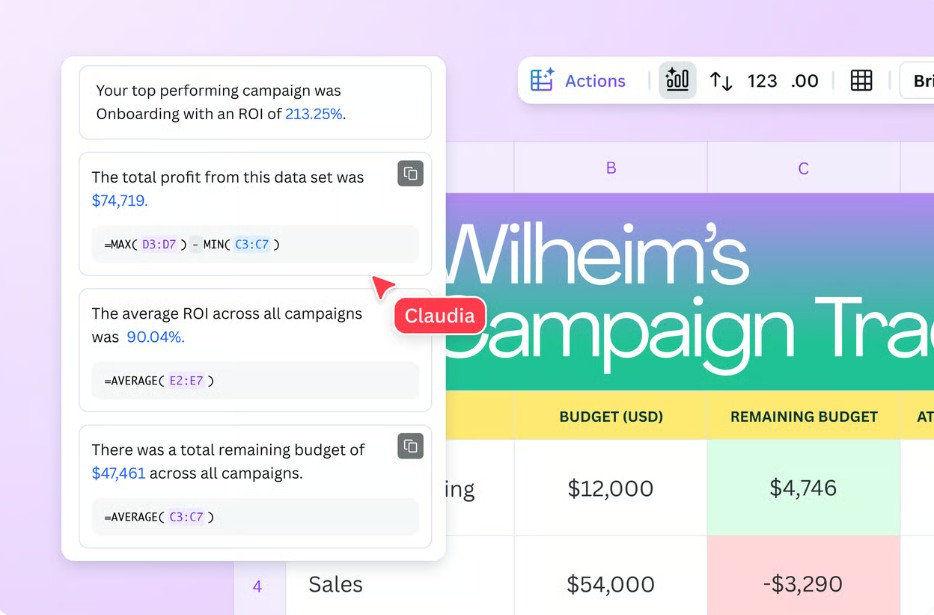
Users don't need to remember complex functions in Excel or Google Sheets.
Simply describe your requirements using natural language, and the AI will suggest a suitable formula.
For example:
"Calculate total revenue by region."
"Identify the product with the highest sales."
"Count the number of new customers this month."
Magic Formulas will automatically generate the corresponding recipe, saving users time and minimizing errors.
10. Visualize data with Magic Charts
Magic Charts is a tool that helps create smart charts in Canva Sheets.
Instead of manually selecting the appropriate chart type, AI will analyze the data and suggest the optimal presentation method.
As a result, ordinary spreadsheets can be quickly transformed into professional, visual reports.
This is especially useful for businesses that need to present data to customers, investors, or management teams.
11. Conclusion
AI data analysis is changing the way people work with data. Instead of spending hours processing spreadsheets and building reports manually, users can now harness the power of AI to quickly discover trends, identify opportunities, and make more accurate decisions.
With Magic Insights in Canva Sheets, data analysis becomes simpler, more intuitive, and more accessible than ever before. From automatically detecting trends and creating intelligent charts to providing data summaries and integrating directly into Canva designs, this tool transforms complex numbers into understandable and valuable data stories.
For businesses, marketers, managers, or anyone who frequently works with data, Magic Insights is not just an analytical tool but also an AI assistant that saves time, improves efficiency, and effectively supports data-driven decision-making.
















VIP Products




Best Selling Products
Adobe Premiere Pro Account
99 USD
Plugin Retouch4me
69 USD
Genuine Adobe Illustrator account
99 USD
MidJourney Account
29 USD
Freepik Premium Account
59 USD
Upgrade Duolingo Super
29 USD
Autodesk All App Account Copyright
120 USD
Copyright Adobe Lightroom Account
59 USD
Windows 10 & 11 Pro Key
36 USD
Genuine Cheap Canva Pro
39 USD
ChatGPT Plus Account (GPT-4)
16 USD
Adobe Photoshop Copyright - Full App
120 USD
Upgrade Genuine Office 365
49 USD
Capcut Pro 1 Year
39 USD
Upgrade genuine Capture One account
120 USD