Best Selling Products

ChatGPT Plus Account (GPT-4)
16 USD
Upgrade genuine Capture One account
120 USD
Windows 10 & 11 Pro Key
36 USD
Plugin Retouch4me
69 USD
Upgrade Genuine Office 365
49 USD
Capcut Pro 1 Year
39 USD
Freepik Premium Account
59 USD

Genuine Cheap Canva Pro
39 USD
Autodesk All App Account Copyright
120 USD

Adobe Photoshop Copyright - Full App
120 USD

MidJourney Account
29 USD

Copyright Adobe Lightroom Account
59 USD
Genuine Adobe Illustrator account
99 USD
Upgrade Duolingo Super
29 USD

Adobe Premiere Pro Account
99 USD
Discover the best charting software for reports and presentations.
Nội dung
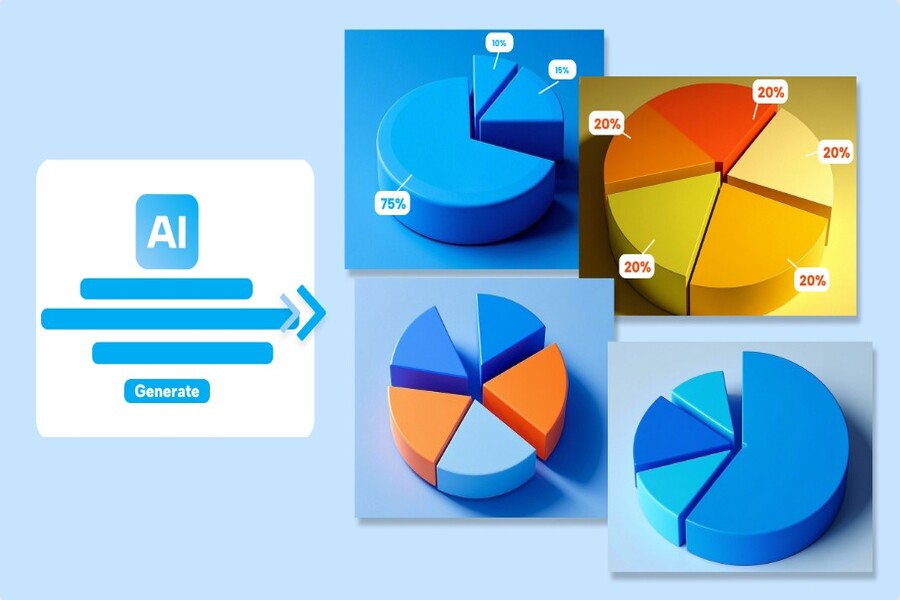
A clear chart can help viewers understand data in just seconds. Today's charting tools offer a wide range of powerful features, from graphic design to data analysis.
1. Lucidchart
Lucidchart is one of the most popular online data visualization tools available today. This platform allows users to create various types of charts and diagrams with simple drag-and-drop functionality. Because it runs entirely in a web browser, users don't need to install any software and can work from any device with an internet connection.
Lucidchart's greatest strength lies in its user-friendly interface. Users can choose from hundreds of pre-made chart templates to start their projects. These templates include various data visualization formats such as bar charts, line charts, pie charts, process diagrams, and organizational charts. Thanks to this, even those with little design experience can create clear and professional charts.
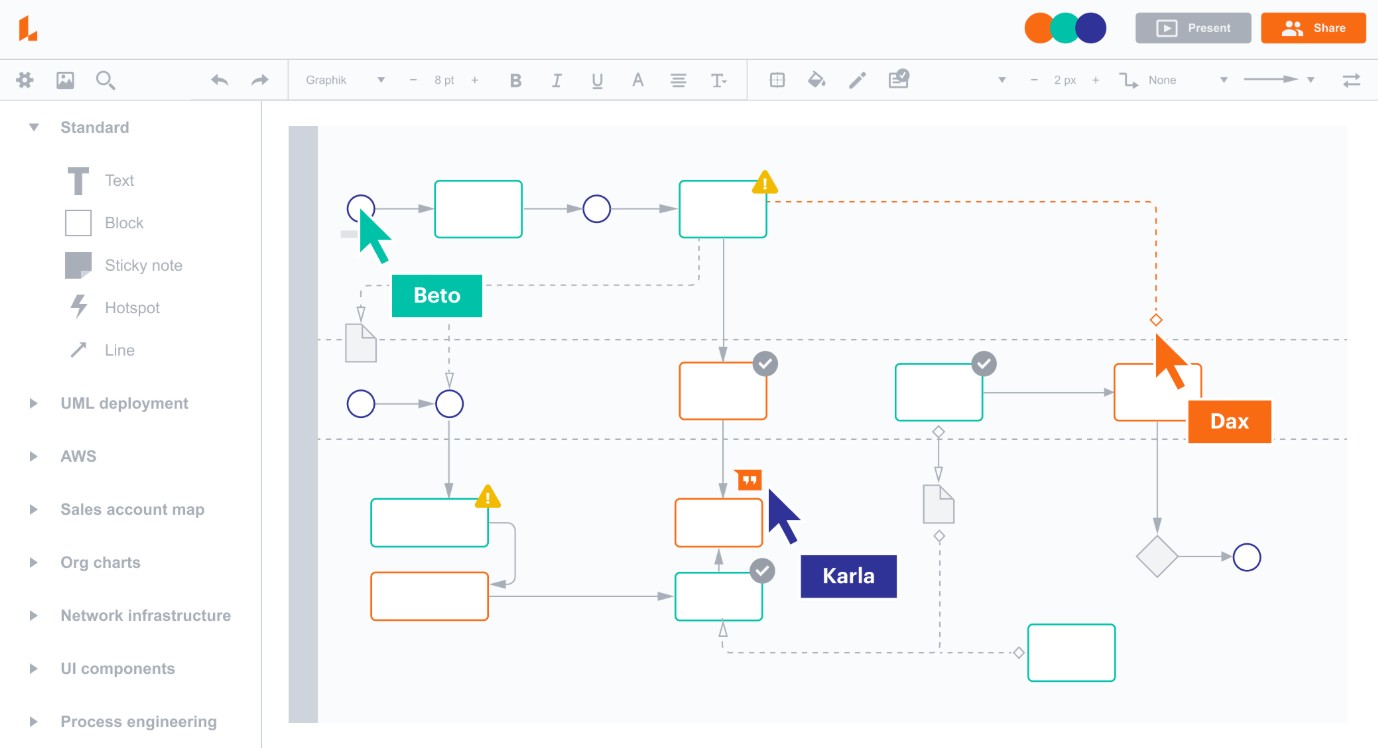
Another advantage of Lucidchart is its ability to collaborate in real time. Multiple people can edit a chart simultaneously within the same project, leaving comments or suggesting changes. This is especially useful for remote teams or projects requiring coordination across multiple departments.
Additionally, Lucidchart supports importing data from spreadsheets. Users can link charts to data from various sources, and when the data is updated, the chart will automatically change accordingly. This saves time and ensures the accuracy of the information.
2. Adobe Illustrator
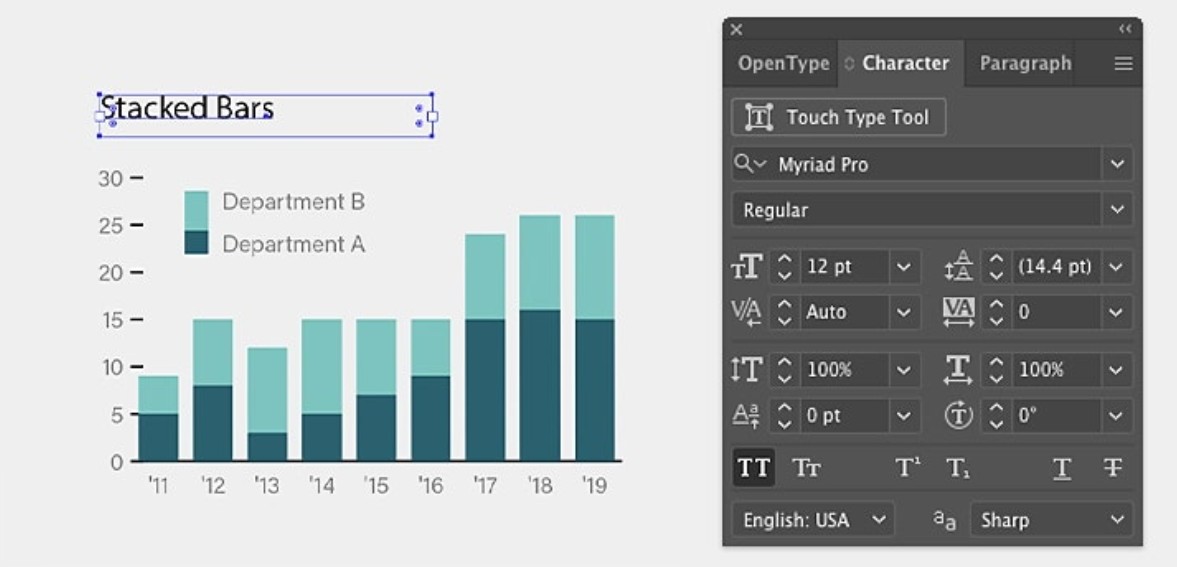
Adobe Illustrator is a popular vector graphics software widely used in the design industry. Although not a specialized tool for data visualization, Illustrator is still chosen by many designers to create charts due to its extremely flexible design customization capabilities.
In Illustrator, users can create various types of charts, such as bar charts, pie charts, line charts, and scatter plots. After creating the chart, designers can edit each element of the graphic, from color and font to layout. This helps ensure that the charts not only convey data effectively but also have high aesthetic value.
A key advantage of Illustrator is its ability to integrate with the Adobe Creative Cloud ecosystem. Designers can easily combine charts with other graphic elements to create infographics, posters, or presentation slides. This ensures that data is not only presented clearly but also becomes an integral part of the overall design.
However, Illustrator has a rather complex interface for beginners and requires learning time to use proficiently. Additionally, the software is paid, so it's generally more suitable for professional designers or those who need to create high-level data graphics.
3. Google Charts
Google Charts is a data visualization library developed by Google. This tool allows users to create interactive charts that can be directly embedded into websites or web applications. It's a popular choice for developers who want to display data in a dynamic and easy-to-understand way.
One of the major advantages of Google Charts is its ability to connect data from many different sources. Users can pull data from spreadsheets, databases, or APIs to create dynamic charts. When the data changes, the charts automatically update in real time.
Google Charts supports a wide variety of chart types, from basic ones like bar, line, and pie charts to more complex visualizations such as map charts or scatter plots. Charts can also be customized using JavaScript code to match the website's design.
However, using Google Charts requires users to have basic programming knowledge. This can be a barrier for those unfamiliar with working with source code.
4. FusionCharts
FusionCharts is a powerful data visualization platform designed for enterprise applications. This tool offers dozens of different chart types, helping users create detailed data analysis dashboards.
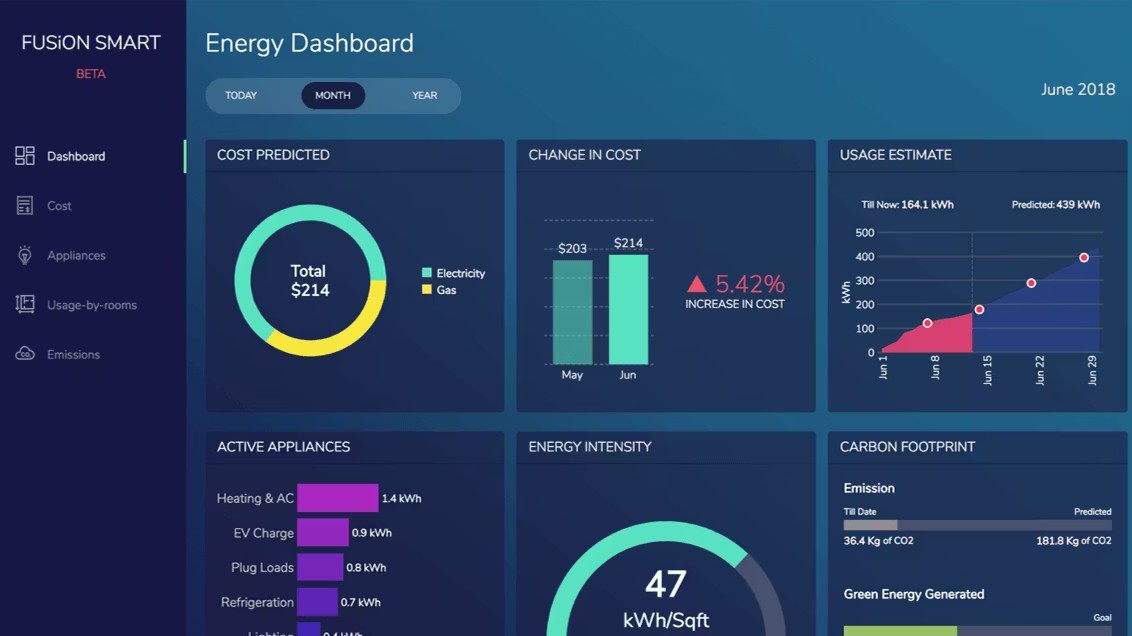
FusionCharts are particularly useful in large-scale data management systems. The charts can display information in real time, helping managers monitor business performance and make quick decisions.
Another advantage of FusionCharts is its ability to integrate with many different web development frameworks. This makes it easier for developers to build data analytics applications with intuitive and user-friendly interfaces.
5. Adobe Express
Adobe Express is an online design platform that allows users to create graphics, posters, and charts in minutes. This tool is geared towards those who need to create visual content for social media, blogs, or presentations.
Adobe Express offers a variety of ready-made chart templates, allowing users to quickly transform data into visual representations. Users simply need to input data and select the appropriate chart style, then adjust colors or fonts to complete the design.
The advantage of Adobe Express is its simple and user-friendly interface. Even those without design experience can create beautiful charts in just a few minutes.
6. Microsoft Visio
Microsoft Visio is a widely used diagramming and charting software in business environments. This tool allows the creation of various types of diagrams, such as process diagrams, organizational charts, and data charts.
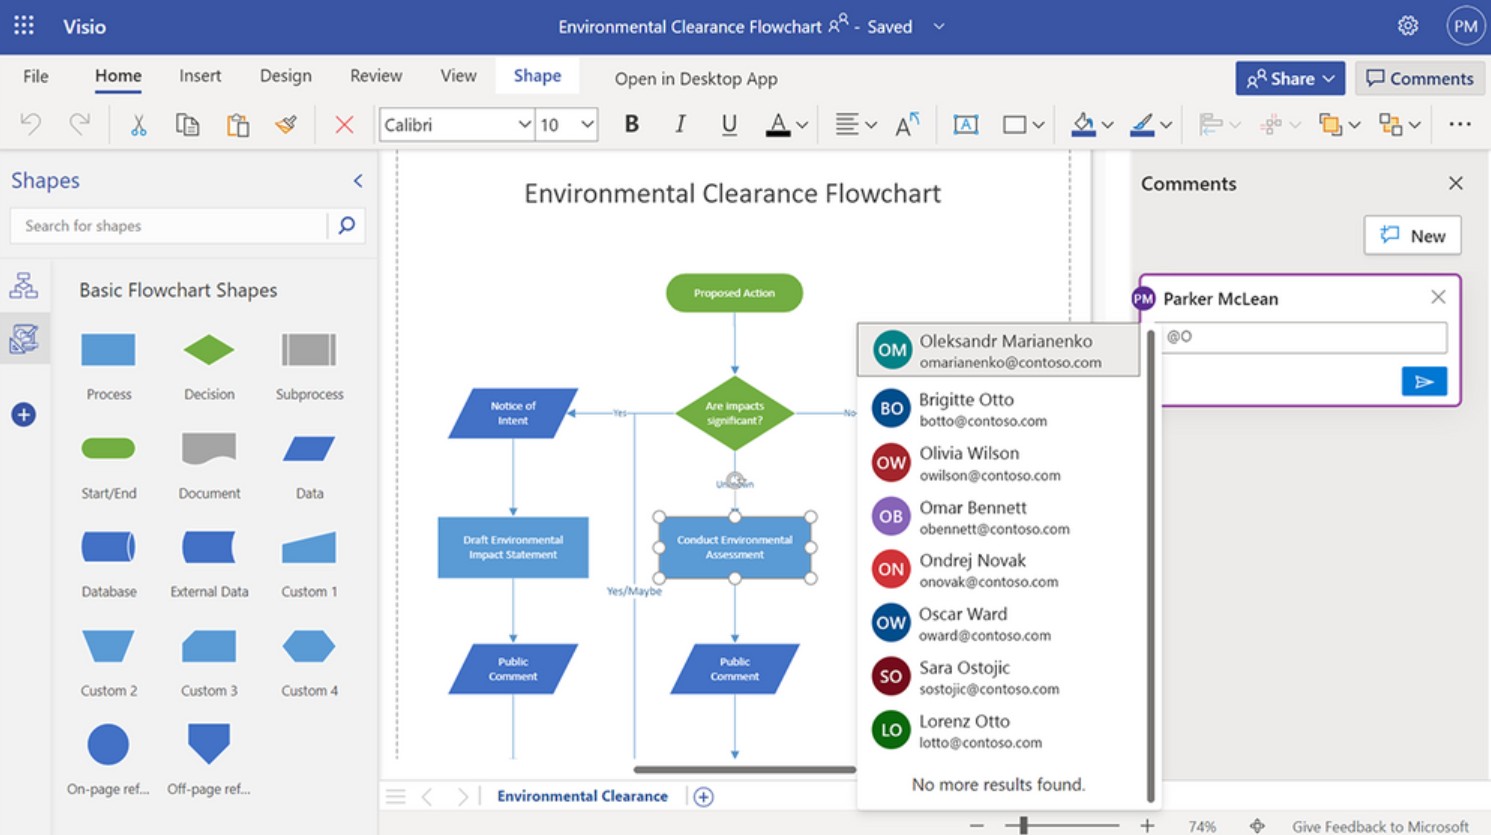
Visio has the ability to integrate tightly with other products in the Microsoft ecosystem. Users can link charts to data in Excel to automatically update information.
Thanks to its efficient data management capabilities, Visio is often used in internal reporting or process management projects.
7. Table
Tableau is one of the most powerful data visualization platforms available today. It is widely used in data analytics and business.
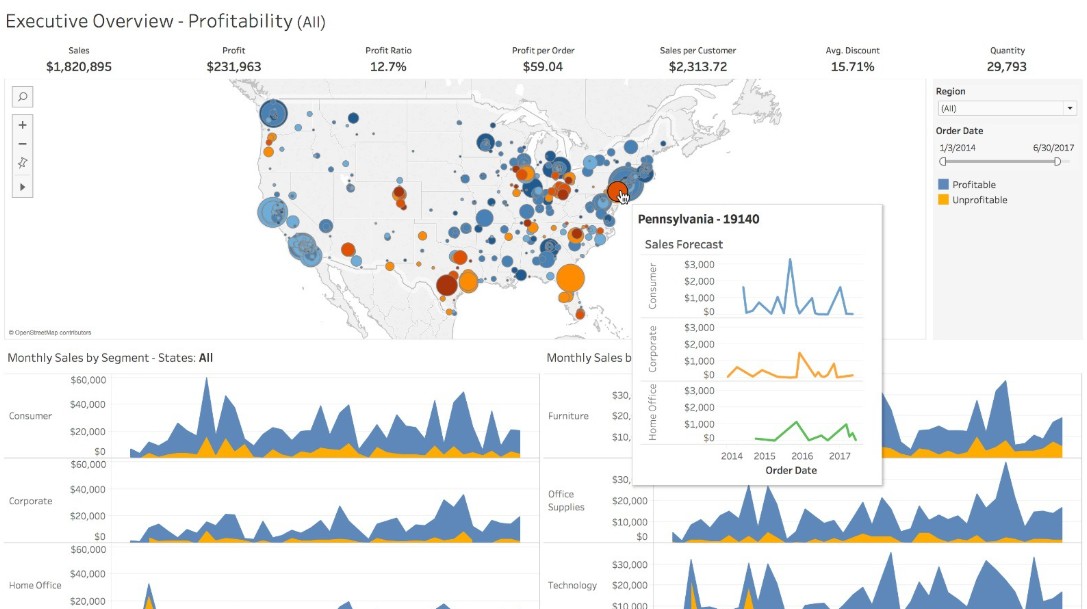
Tableau allows users to create interactive dashboards with a variety of chart types. Charts can be linked to data from multiple sources such as spreadsheets, databases, or cloud services.
One of Tableau's strengths is its ability to perform in-depth data analysis. Users can filter data, explore trends, and discover relationships between factors through intuitive charts.
8. Stackby
Stackby is an online data management tool that combines spreadsheet and project management software. This platform allows users to create data tables and visualize information using various chart types.
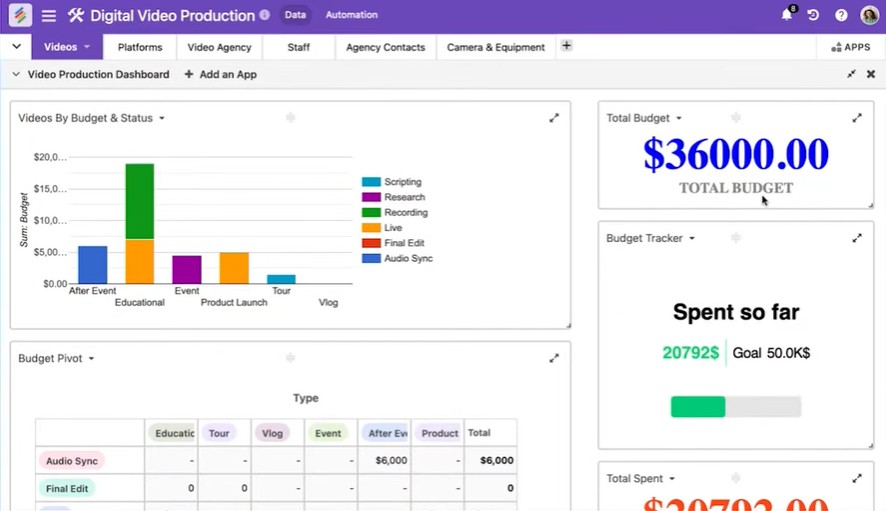
When the data in the table changes, the charts will also update automatically. This helps users easily track project progress or work performance.
Stackby is particularly suitable for small teams or freelancers who need to manage data and create visual reports without using many different tools.
9. PresenterMedia
PresenterMedia is an online platform that provides table and chart templates for presentations. Users can choose from available chart templates and edit the content to suit their projects.
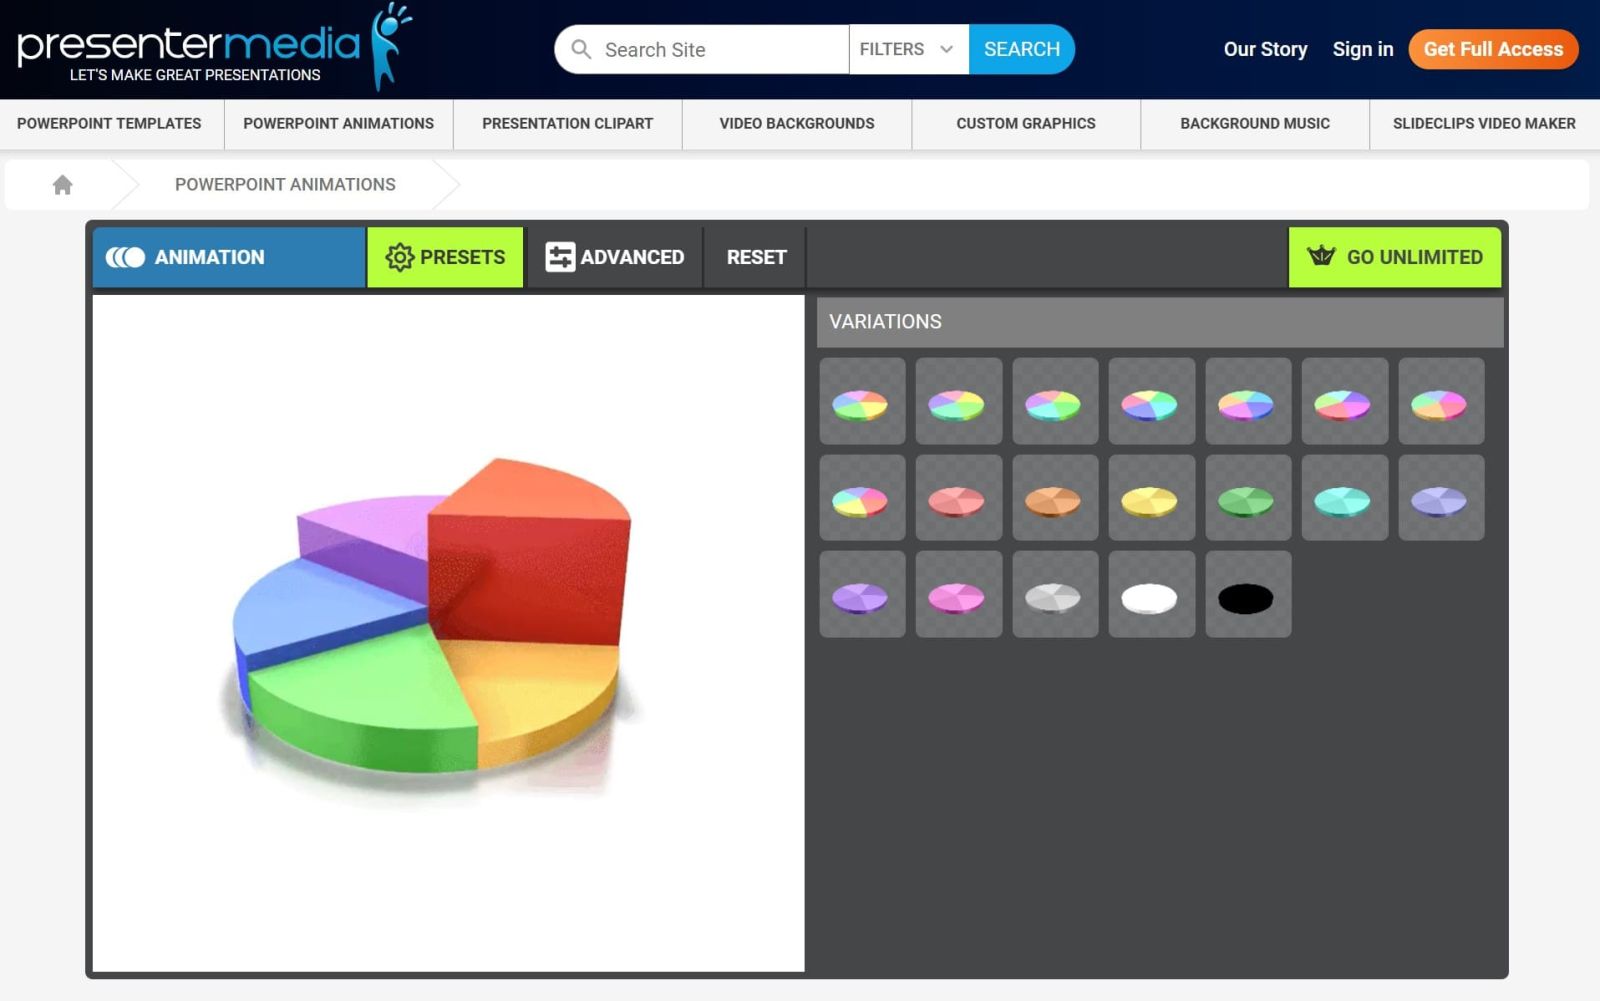
Charts from PresenterMedia can be integrated directly into PowerPoint, allowing users to create professional presentations without having to design them from scratch.
As data becomes increasingly central to many fields, the ability to tell stories through data using tables and charts will become a crucial skill. Modern visualization tools not only help us understand data better but also open up many creative opportunities in how we present and communicate information.


VIP Products


Best Selling Products
ChatGPT Plus Account (GPT-4)
16 USD
Upgrade genuine Capture One account
120 USD
Windows 10 & 11 Pro Key
36 USD
Plugin Retouch4me
69 USD
Upgrade Genuine Office 365
49 USD
Capcut Pro 1 Year
39 USD
Freepik Premium Account
59 USD
Genuine Cheap Canva Pro
39 USD
Autodesk All App Account Copyright
120 USD
Adobe Photoshop Copyright - Full App
120 USD
MidJourney Account
29 USD
Copyright Adobe Lightroom Account
59 USD
Genuine Adobe Illustrator account
99 USD
Upgrade Duolingo Super
29 USD
Adobe Premiere Pro Account
99 USD