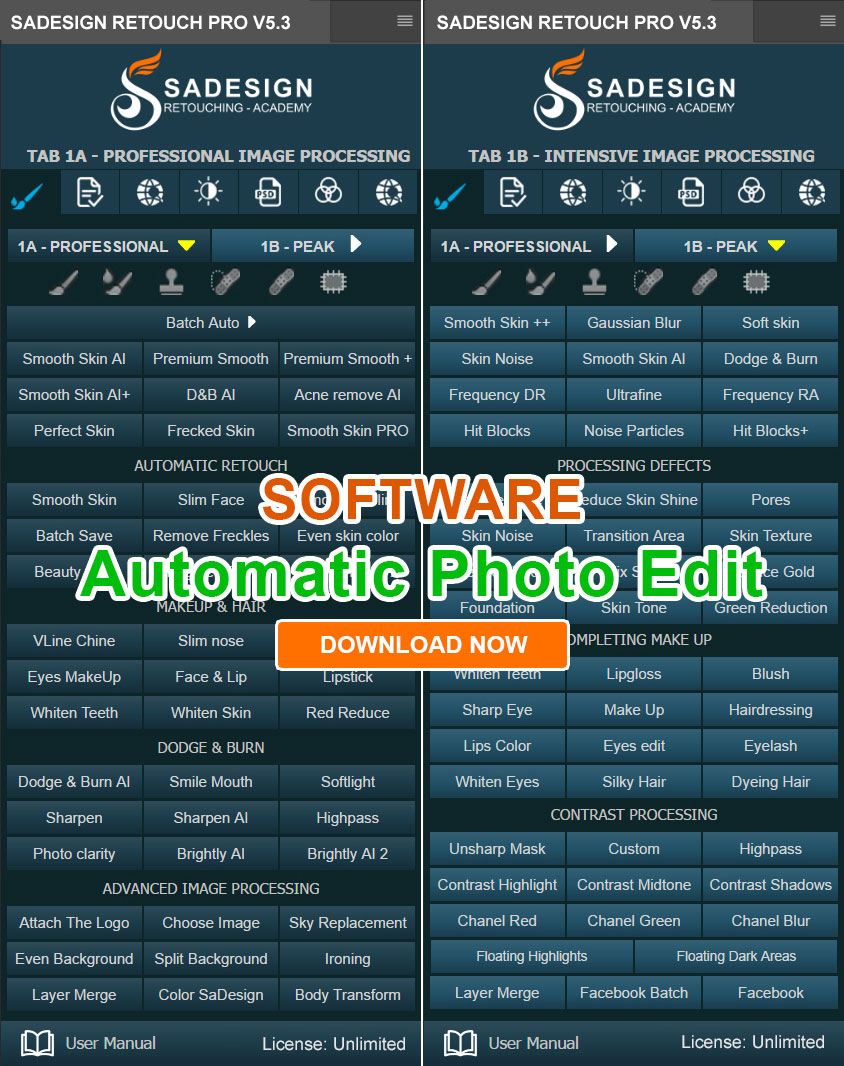
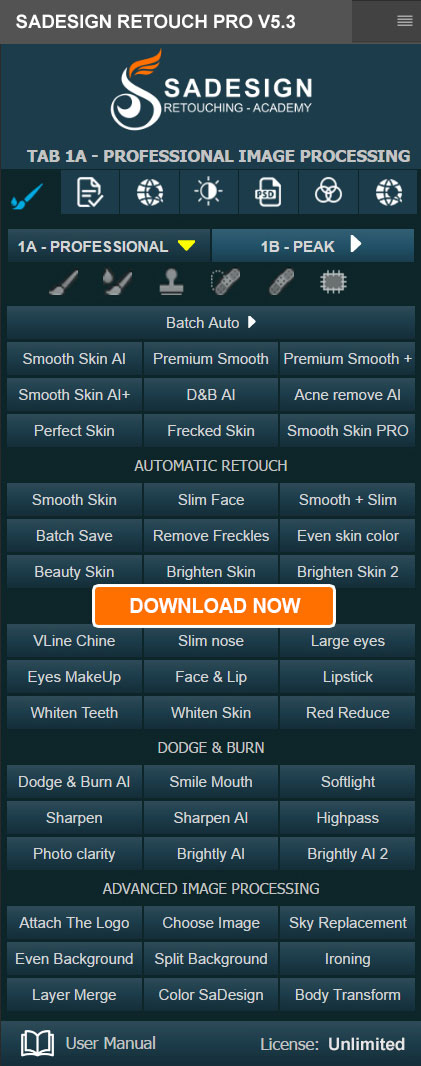
Best Selling Products

Adobe Premiere Pro Account
99 USD

Windows 10 & 11 Pro Key
36 USD

Plugin Retouch4me
69 USD

MidJourney Account
29 USD

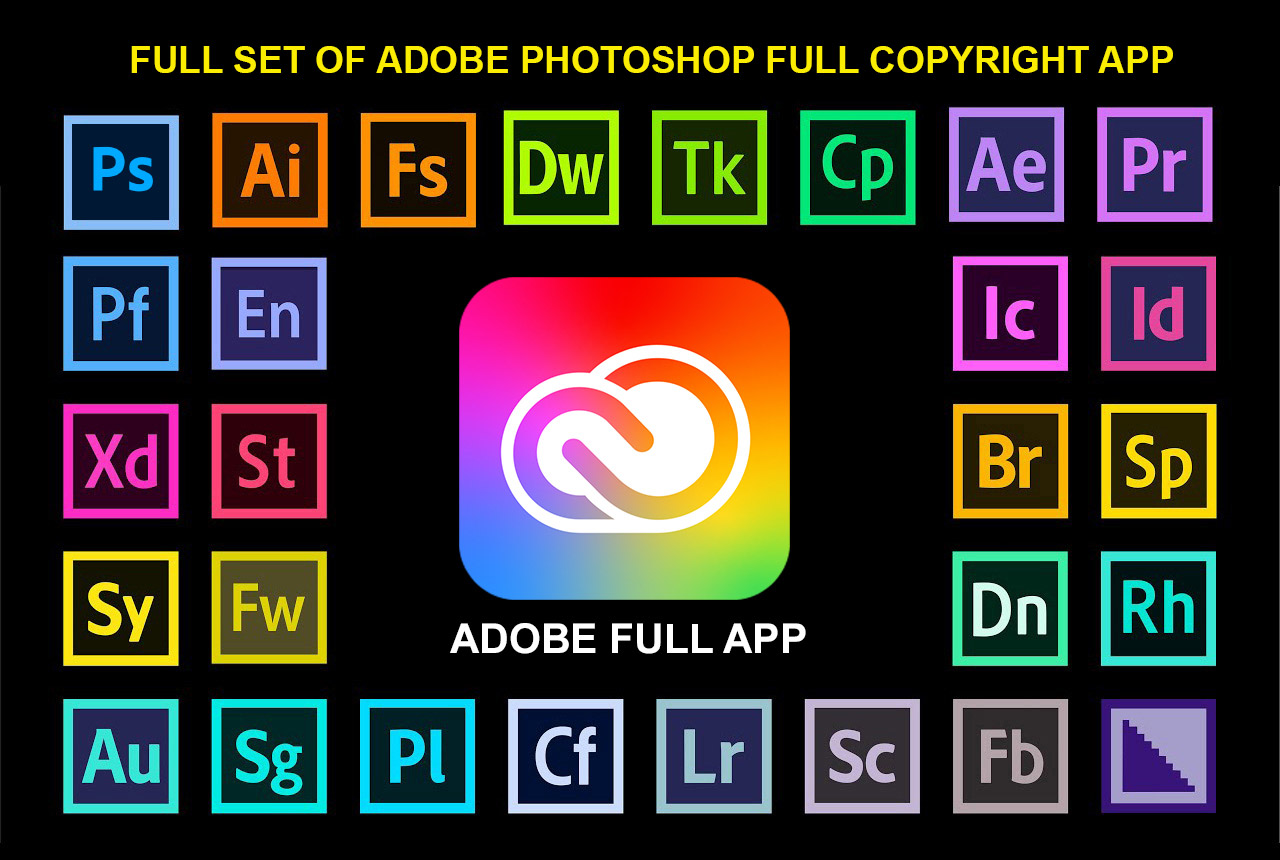
Adobe Photoshop Copyright - Full App
120 USD

Genuine Cheap Canva Pro
39 USD

Upgrade Duolingo Super
29 USD

Upgrade Genuine Office 365
49 USD
Upgrade genuine Capture One account
120 USD
Genuine Adobe Illustrator account
99 USD

Freepik Premium Account
59 USD

Capcut Pro 1 Year
39 USD
Autodesk All App Account Copyright
120 USD

Copyright Adobe Lightroom Account
59 USD

ChatGPT Plus Account (GPT-4)
16 USD
Steps to Design Beautiful, Attractive Infographics
Nội dung
- 1. What is an infographic?
- 2. The Role of Infographics in Marketing
- 3. Benefits of Infographics
- 4. Important factors that create Infographic
- 4.1 Skimming ability
- 4.2 Using metaphors
- 4.3 Creating Slides
- 4.4 Beautiful Data
- 4.5 Using Bar Graph
- 4.6 Using copies
- 4.7 Telling visual stories
- 4.8 Be careful when using comparative images
- 5. Steps to design an impressive Infographic
- 5.1 Step 1: Determine the Infographic topic
- 5.2 Step 2: Come up with an idea for implementation
- 5.3 Step 3: Collect and select information
- 5.4 Step 4: Tell a powerful story
- 5.5 Step 5: Proceed to design Infographic
- 5.7 Step 7: Consult with others
- 5.8 Step 8: Promote and share
- 6. Conclusion
In today's digital age, infographics have become a powerful tool to convey information effectively and attractively. A beautiful infographic not only helps viewers easily receive information but also creates a deep impression, making them remember the content longer. However, to design an attractive infographic, you need to go through many steps from coming up with ideas, choosing colors, to arranging a reasonable layout. In this article, let's explore with Sadesign the steps to design a beautiful infographic, from basic principles to optimization tips to improve aesthetics and message transmission effectiveness.

In today's digital age, infographics have become a powerful tool to convey information effectively and attractively. A beautiful infographic not only helps viewers easily receive information but also creates a deep impression, making them remember the content longer. However, to design an attractive infographic, you need to go through many steps from coming up with ideas, choosing colors, to arranging a reasonable layout. In this article, let's explore with Sadesign the steps to design a beautiful infographic, from basic principles to optimization tips to improve aesthetics and message transmission effectiveness.
1. What is an infographic?
Infographic, a portmanteau of “Information” and “Graphic,” is a sophisticated combination of information and images to convey content in a visual and vivid way. Instead of just using text to describe, infographics use icons, images, and eye-catching colors to turn complex information into easy-to-understand and memorable parts. This helps viewers grasp content more quickly and effectively, especially in an era where readers’ time and attention are extremely valuable.
This format not only makes information more appealing but also increases memorability. We tend to remember images better than written words. When a concept is illustrated with pictures and diagrams, the viewer is much more likely to understand and remember the information. Infographics have become an indispensable tool in conveying knowledge, from education to marketing.
The explosive growth of infographics over the past decade has proven its vital role in communication. In the classroom, at work, or even on websites, infographics help create deeper interaction and understanding between the communicator and the receiver of information. This is the reason why infographics have become an indispensable design trend.
.png)
2. The Role of Infographics in Marketing
In the field of marketing, infographics are currently considered one of the top trends of Content Marketing. Consumers increasingly prefer short, concise content that is presented visually and uniquely. Infographics perfectly meet this need by helping brands convey messages quickly without boring viewers.
Instead of having to read a long advertisement, users can simply look at an infographic to understand all the necessary information. This not only saves time but also improves communication efficiency. An attractive infographic design can attract attention at first sight, stimulate curiosity and encourage viewers to learn more about the product or service.
Furthermore, with the ability to be easily shared on social media platforms, infographics help increase reach and engagement with the target audience. This is important in building a brand and creating long-term relationships with customers. By using infographics, marketers can create unique, impactful content that can easily spread to the community.
3. Benefits of Infographics
Infographics bring many outstanding benefits not only to the designer but also to the viewer. First, with a simplified presentation, information becomes easier to understand and remember. Viewers no longer feel frustrated when faced with a large amount of text, but instead are vivid images and icons that help them absorb content in a natural and interesting way.
Second, infographics help organize information in a logical and coherent way, minimizing the possibility of misunderstanding. When elements are organized logically, viewers can easily follow and identify key points without being distracted. This is especially important in education and communication, where clarity and accuracy are paramount.
Finally, with its shareable and viral nature, infographics go beyond simply conveying information to creating opportunities for interaction and connection between the communicator and the recipient. This is why many organizations, from businesses to non-profits, have chosen infographics as an effective tool to raise awareness and engage with the public.
(1).png)
4. Important factors that create Infographic
To create an impressive and effective infographic design, you need to master some important elements. These elements not only help you convey information clearly but also make the infographic more attractive and easier for viewers to understand. Here are the elements to pay attention to:
4.1 Skimming ability
One of the main goals of an infographic is to make it easy for viewers to access complex information without feeling overwhelmed. Scannability is key in infographic design. When users scan through it, they can grasp more than 90% of the message you want to convey. To achieve this, you need to use clear presentation, combined with vivid illustrations and important highlights. Instead of a large volume of text, prioritize using concise headlines, charts and images to highlight the core information.
4.2 Using metaphors
Metaphors are a powerful tool in infographic design. Instead of just presenting dry numbers, you can use images and symbols to create visual connections. For example, if you are reporting on revenue growth, instead of just presenting numbers, visualize it with a picture of a tree growing. This not only brings the information to life, but also makes it easier for viewers to understand and remember the content.
4.3 Creating Slides
Infographics are more than just static images. Using 3D images or slides can create a more interactive experience for viewers. These slides can explain, add information, and help readers follow the flow of the message. When designing, consider breaking the information into smaller sections, each of which can be a separate slide, creating a compelling visual story.
.png)
4.4 Beautiful Data
An effective infographic is not just about presenting data, but also about making it visually appealing and easy to understand. How you process and present data determines how users perceive the information. Think of data as pieces of art, arranged in a harmonious and attractive way. Use different colors, shapes, and sizes to highlight important elements, making it easy for viewers to grasp the core content at first glance.
4.5 Using Bar Graph
Bar Graphs are one of the most popular tools in infographic design. However, to make your mark, you need to be creative and innovative in your presentation. Instead of just using a regular bar graph, experiment with more unique forms, such as pie charts or 3D charts, to create a difference. This will not only attract attention but also make it easier for viewers to compare and analyze data.
4.6 Using copies
Copy is an important element in infographics that helps to display a variety of data in different contexts. Using copy wisely not only helps to minimize space but also creates consistency in the design. Make sure that copy elements are clearly presented, making it easy for viewers to follow and understand the information you are trying to convey.
.png)
4.7 Telling visual stories
A successful infographic is not just about presenting information, it is about telling a story. Each section of the infographic should be designed to take the viewer on a journey, from start to finish. Use software like After Effects or Illustrator to create moving or interactive elements that help the viewer experience the story in a more dynamic and engaging way.
4.8 Be careful when using comparative images
Comparing data is a crucial part of infographics, but you need to be careful how you do it. Use charts, graphs, or images to convey comparisons in a clear and easy-to-understand way. Make sure the images you choose are not just illustrative, but help viewers immediately recognize the differences and correlations between the data.
5. Steps to design an impressive Infographic
5.1 Step 1: Determine the Infographic topic
The first and most important step in the infographic design process is to clearly define the topic you want to convey. The topic is not only the title of the infographic but also the core message you want the reader to remember. Choosing a suitable and attractive topic will help you easily visualize related elements such as design style, color, and content needed for the infographic.
Once you have a theme in mind, developing design ideas becomes much easier. Instead of wandering through a sea of information, you have a clear direction, helping you focus on creating a complete and attractive product.
5.2 Step 2: Come up with an idea for implementation
Once you have decided on a topic, the next step is to brainstorm. This is where you can sketch out the layout of your infographic, and then select the appropriate data, images, and words. A detailed plan will help you avoid confusion during the design process, especially if you want to build a video infographic or a landing page.
Think about how you want your audience to interact with your infographic. You can make a list of the elements that will appear in your design, from images to charts, to make sure everything is connected and serves the overall message.
5.3 Step 3: Collect and select information
Once you have a clear idea, the next step is to collect and filter information. Searching for data from reliable sources such as books, newspapers, and reputable websites will help you get accurate and useful information. Remember that the information you choose needs to be relevant to the topic and ideas you have developed earlier.
Carefully curating information will help create an infographic that is not only unique but also valuable. Don’t be afraid to remove unnecessary data, because a successful infographic is not a competition of quantity but of quality and presentation.
5.4 Step 4: Tell a powerful story
A great infographic is not just about presenting information, it’s about telling a story. Think about how you want to guide your audience through each section of your infographic. Each section should be structured like a story, with a clear introduction, body, and conclusion.
A compelling introduction will grab the reader’s attention right from the start, while the conclusion should wrap up all the information in a neat and impressive way. A strong story will help the reader not only understand but also remember the message you want to convey.
.png)
5.5 Step 5: Proceed to design Infographic
Once you have everything ready, it’s time to design your infographic. Color is a key element in design. Think carefully about how you use color to not only highlight information but also create harmony in the overall design.
If you are designing a video infographic, sound, images and effects should also be taken into account. Make sure that your output is of the highest quality possible, as a poor quality design, no matter how elaborate, will detract from the message.
5.6 Step 6: Visually Present Data
When designing an infographic, many people focus on the graphics and forget that the information is just as important. Make sure the data you present is accurate and easy to understand. Taking the time to research and verify information will help increase the credibility of your infographic.
By presenting information visually, it will be easier for your audience to access and understand the content you want to convey. Remember that the ultimate goal is to help readers quickly grasp the information without feeling overwhelmed.
5.7 Step 7: Consult with others
If you are having trouble designing, don’t hesitate to ask for help from others. You can seek opinions from people who have experience in graphic design or from friends. Different perspectives will help you improve and perfect your infographic.
Make sure the people you consult have a basic knowledge of graphics, so they can give you useful feedback that is relevant to your goals.
5.8 Step 8: Promote and share
Once you have your infographic ready, it’s time to get it out into the world. Don’t rely solely on search engines to attract viewers; make the most of social media platforms like Facebook, Twitter, and especially Pinterest.
Sharing your infographic with a catchy caption and the right hashtags will help increase your reach and drive traffic to your website. Don’t forget to monitor your audience’s feedback so you can adjust and improve for your next project!
.png)
6. Conclusion
Infographic design is not only about creating eye-catching images but also the art of combining information and visualization. Through the steps presented, you can create products that are not only beautiful but also have high communication value. In particular, Adobe Photoshop is the perfect Infographic creation tool. If you need to upgrade, please contact Sadesign immediately for detailed advice and enjoy many other preferential policies!


VIP Products


Best Selling Products
Adobe Premiere Pro Account
99 USD
Windows 10 & 11 Pro Key
36 USD
Plugin Retouch4me
69 USD
MidJourney Account
29 USD
Adobe Photoshop Copyright - Full App
120 USD
Genuine Cheap Canva Pro
39 USD
Upgrade Duolingo Super
29 USD
Upgrade Genuine Office 365
49 USD
Upgrade genuine Capture One account
120 USD
Genuine Adobe Illustrator account
99 USD
Freepik Premium Account
59 USD
Capcut Pro 1 Year
39 USD
Autodesk All App Account Copyright
120 USD
Copyright Adobe Lightroom Account
59 USD
ChatGPT Plus Account (GPT-4)
16 USD