Best Selling Products
Upgrade genuine Capture One account
120 USD
Autodesk All App Account Copyright
120 USD
Genuine Adobe Illustrator account
99 USD

Genuine Cheap Canva Pro
39 USD

MidJourney Account
29 USD

Adobe Photoshop Copyright - Full App
120 USD

Freepik Premium Account
59 USD
Capcut Pro 1 Year
39 USD

ChatGPT Plus Account (GPT-4)
16 USD
Windows 10 & 11 Pro Key
36 USD

Upgrade Duolingo Super
29 USD
Upgrade Genuine Office 365
49 USD

Copyright Adobe Lightroom Account
59 USD

Adobe Premiere Pro Account
99 USD
Plugin Retouch4me
69 USD
What is Infographic and How to Create Beautiful, Easy-to-Understand Infographics
Nội dung
Don't let boring designs overshadow your content! Learn how to create simple infographics that are still highly engaging.
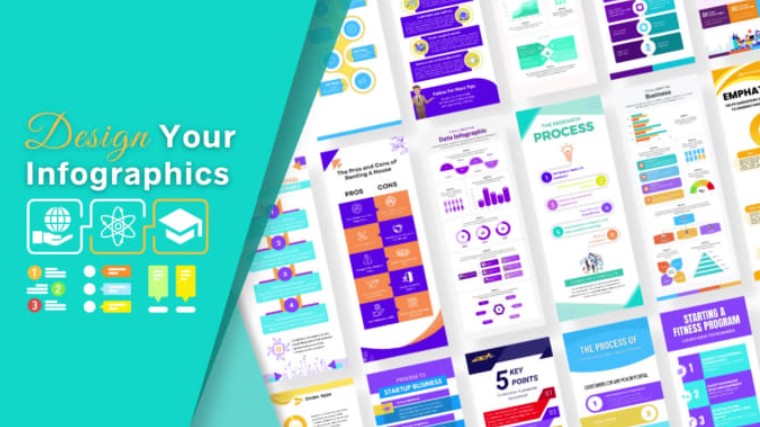
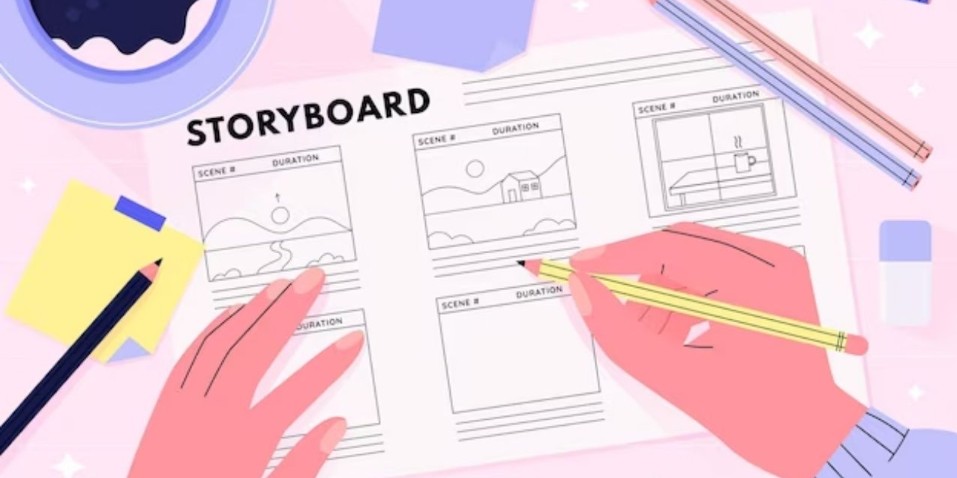
In today’s digital age, information conveyed through online media channels requires visuals and ease of understanding. Infographics – a combination of images and information – are the ideal tool to help you convey data in a vivid and effective way. This article will guide you on how to create an infographic that is not only eye-catching but also simple and quick, suitable for all audiences.
1. Definition and Role of Infographic
Infographics are a form of information communication that combines graphics, charts and text. Widely used in marketing, journalism, education and business, infographics help audiences easily grasp information through data visualization. This combination not only helps create a strong first impression but also makes information more “alive”, accessible and memorable.
A great infographic is more than just a work of art; it's a powerful communication tool. When designed correctly, infographics can help you:
Attract attention at first sight.
Convey the message clearly and coherently.
Enhance communication and brand promotion effectiveness.
.png)
2. Why Use Infographics?
Infographics help readers easily understand and grasp what a business or brand wants to convey. This is a very effective way to bring messages to everyone. It can be said that Infographics are the solution for content that is difficult to explain in words.
Therefore, using Infographic will bring you many advantages, typically:
Quickly explain a complex problem.
Provide an overview of a topic.
Present statistical and research data.
Compare multiple objects together
Summarize long reports.
Alerts about conditions and problems, their causes or solutions.
Therefore, when presenting a difficult problem, Infographic can be an effective solution for you. In particular, Infographic is widely used in the fields of business and marketing.
3. Infographic Design Process
.png)
To make an Infographic, you first need to identify the steps to take and follow them to avoid mistakes.
Identify the topic and synthesize information
The first thing when designing an Infographic is to compile information, images, and data. Then summarize them. You can create an Infographic diagram as follows:
Identify primary keywords for the content.
Identify main title, introduction, subtitle, figures (outline).
Condense the content and ensure clarity and completeness.
Choose a clear, easy-to-read font.
Combine with fonts to make Infographic more attractive.
Add a logo or signature to copyright your product.
Choose software and start designing Infographic
With these advantages, you can use many software or online applications to create unique and attractive infographics.
Below, SaDesign will guide you through the 2 simplest and fastest ways to create Infographics: using available Templates and designing online on the Canva tool.
.png)
Design Infographics with Templates
Using ready-made templates is the fastest way to create an Infographic. You can refer to or collect these templates from many places.
Design Infographic Online on Canva platform
The Canva platform provides many tools to support design and photo editing. This tool has both free and paid versions, so the process of finding resources will not take as much time as other applications.
4. Tips and Tricks for Making Infographics Quickly
Not everyone has the time to spend tweaking every detail of an infographic. Here are some tips to help you get it done quickly while still maintaining quality.
4.1. Using Available Design Templates
Design tools like Canva, Piktochart or Adobe Spark offer a wide variety of templates:
.png)
Save time: You only need to customize some basic information to have a beautiful product. This is especially useful when you need to complete a project in a hurry.
Easy customization: Pre-designed templates help guide the overall layout and style, you just need to change the colors, fonts and content to suit.
Professionalism Guaranteed: Expertly crafted designs always ensure visual elements, making your product look more professional.
4.2. Use Short and Concise Text Paragraphs
One of the secrets to a successful infographic is keeping the information short and easy to understand:
Strong Titles: Choose short but catchy titles that help viewers grasp the main idea immediately.
Concise paragraphs: Minimize long paragraphs. Provide only basic information and allow for supporting images and charts.
Bullet points: Use bulleted lists to list main ideas, creating a light and easy-to-read feel.
4.3. “Drag and Drop” Technique in Design Software
.png)
Modern tools all have drag and drop features that make it easy to arrange and move elements in your infographic:
Optimize layout : With just drag and drop, you can experiment with different layout arrangements until you get the result you want.
Save time: No complicated operations required, helping you complete your design quickly.
Creative freedom: Easily change the position of elements to suit the information transmission goal.
5. Related Questions
To help you gain more insight and answer some common questions during the infographic design process, SaDesign has compiled some related questions that many designers and marketers are interested in:
Are infographics really necessary for my communications strategy?
Infographics can be a powerful tool for visually communicating information, making data more vivid and accessible. Not only does it attract customers’ attention, but it also helps build brands and build trust through the professionalism and clarity of the way information is presented.
How to find reputable data and information for infographics?
To get accurate and reliable data, you should refer to information sources from reputable organizations, independent research reports or official agencies. Verifying information from multiple sources will help you avoid unnecessary errors and ensure the authenticity of your products.
.png)
How to choose the right design tool for your needs?
Each design tool has its own pros and cons. For example, Canva and Piktochart are great for beginners thanks to their friendly interfaces and ready-made templates, while Adobe Illustrator is ideal for design professionals who want detailed control over every element of their designs. Depending on your skills and project requirements, choose the tool that best suits you.
Is it necessary to use multiple colors and fonts in an infographic?
A professional infographic design usually uses 2-3 main colors and 1-2 fonts to ensure consistency, readability and avoid confusing the viewer. Choosing the right colors and fonts not only helps convey the message clearly but also increases the aesthetics of the entire product.
Can I create an infographic myself without a designer?
Even if you are a beginner, with the help of online tools like Canva, Piktochart or Adobe Spark, you can absolutely create a quality infographic yourself. The most important thing is that you need to plan and prepare your data carefully, then apply the basic design tips shared in the previous section.
.png)
If I encounter an error during the design process, what should I do?
It is important to review the entire design, from the data to the small details such as formatting, fonts and colors. You should ask a colleague or friend to review the product for an objective perspective, from which timely adjustments can be made to ensure the final product meets quality standards.
How to optimize infographics for mobile devices?
With the growing trend of mobile usage, make sure your infographic is formatted appropriately to display well on all screen sizes. Column layouts and using easy-to-read font sizes are important to ensure your infographic is user-friendly across all platforms.
Start small, use the tools available, and keep your information clean and easy to digest. Whether you’re a beginner or an expert, continuous learning and improvement will open up new opportunities in your design career.


VIP Products


Best Selling Products
Upgrade genuine Capture One account
120 USD
Autodesk All App Account Copyright
120 USD
Genuine Adobe Illustrator account
99 USD
Genuine Cheap Canva Pro
39 USD
MidJourney Account
29 USD
Adobe Photoshop Copyright - Full App
120 USD
Freepik Premium Account
59 USD
Capcut Pro 1 Year
39 USD
ChatGPT Plus Account (GPT-4)
16 USD
Windows 10 & 11 Pro Key
36 USD
Upgrade Duolingo Super
29 USD
Upgrade Genuine Office 365
49 USD
Copyright Adobe Lightroom Account
59 USD
Adobe Premiere Pro Account
99 USD
Plugin Retouch4me
69 USD